Master Your Social Media Analytics Dashboard

Think of your social media analytics dashboard as your mission control. It takes that chaotic storm of likes, shares, comments, and clicks and translates it into a clear, actionable story about your brand. It’s the cockpit for all your social media efforts, giving you the gauges and readouts you need to navigate with confidence.
Your Command Center for Social Media Data
Trying to manage social media without data is like flying blind. You can post all you want, but you have no real idea if you’re heading in the right direction, gaining altitude, or about to stall. A dashboard cuts through that fog, giving you one central place to see what’s working, what isn’t, and—most importantly—why.
This goes way beyond just tallying up likes and followers. A good dashboard tells a story. It uncovers the narrative hidden in your numbers, showing you how your audience actually feels and behaves. For instance, a spike in impressions is nice, but your dashboard can show you if that same spike led to more clicks on your website. That’s how you know your content didn’t just reach people; it moved them to act.
Moving Beyond Simple Metrics
The real magic happens when a dashboard connects all those separate data points into a single, cohesive strategy. It helps you answer the big questions that vanity metrics can't touch. You stop seeing random numbers and start spotting meaningful patterns and opportunities. To truly get a handle on this and streamline your workflow, you need to Master Your Strategy with a Social Media Dashboard.
A properly set-up dashboard lets you:
- Track Performance in Real-Time: See exactly how a new campaign is doing across all your channels, right now. This means you can make quick adjustments instead of waiting weeks for a report to tell you it's too late.
- Understand Audience Behavior: Figure out which types of content your audience loves, when they're most active, and who your most engaged followers really are.
- Prove Your ROI: Draw a direct line from your social media activity to real business results like leads, sales, and customer loyalty. This is how you justify your budget and prove your strategy works.
A dashboard isn't just a reporting tool; it’s a decision-making engine. It gives you the evidence to stop guessing what your audience wants and start knowing. That’s how you build a data-backed strategy that gets results, time and time again.
Ultimately, this guide is here to help you transform your dashboard from a simple collection of charts into the strategic heart of your entire online presence.
Jumping into your social media analytics dashboard for the first time can feel a bit like staring at the cockpit of a 747. There are dials, charts, and numbers everywhere. What does it all mean?
The trick is to stop seeing it as a wall of data and start recognizing it as the language that tells your brand’s story online.
Think of it like the dashboard in your car. You don't stare at every single gauge all the time. On a quick trip to the store, you're probably just glancing at the speedometer. On a long road trip, the fuel gauge and engine temperature become a lot more important. The same logic applies here—the metrics that matter most depend entirely on what you're trying to achieve.
Decoding the Metrics That Actually Matter
Let’s break down the essential gauges on your social media dashboard so you know exactly what to look for and why. We'll start with the basics—how many people are you even reaching?
H3: Awareness Metrics: Are People Seeing Your Content?
The first metrics you'll probably notice are Reach and Impressions. Think of these as your car's speedometer and odometer. They tell you how far and wide your message is traveling.
- Impressions: This is the total number of times your content was displayed on someone's screen. If one person sees your post five times, that's five impressions. It’s a measure of total visibility.
- Reach: This is the number of unique people who saw your content. That same person who saw your post five times only counts as 1 toward your reach.
So, impressions show how much your content is "out there," while reach tells you the actual size of your audience. High impressions with low reach might mean a small but dedicated group sees your stuff over and over—which can be great for building a tight-knit community. High reach, on the other hand, shows you're successfully getting in front of new eyes.
H3: Engagement Metrics: Is Anyone Actually Listening?
If reach and impressions tell you people saw your content, engagement metrics tell you if they actually cared. This is where the real connection happens.
Your Engagement Rate is like your car’s fuel efficiency gauge. It shows how well your content is turning passive viewers into active participants. It’s a calculation that typically bundles up likes, comments, shares, and saves, then measures them against your reach or follower count.
A high engagement rate is a huge win. It signals to the social media algorithms that people find your content valuable, which means they'll be more likely to show it to even more users. For a deeper dive, check out our guide on the most important social media engagement metrics.
This is where you see how all the pieces fit together. It's not about one metric; it's about the relationship between them.
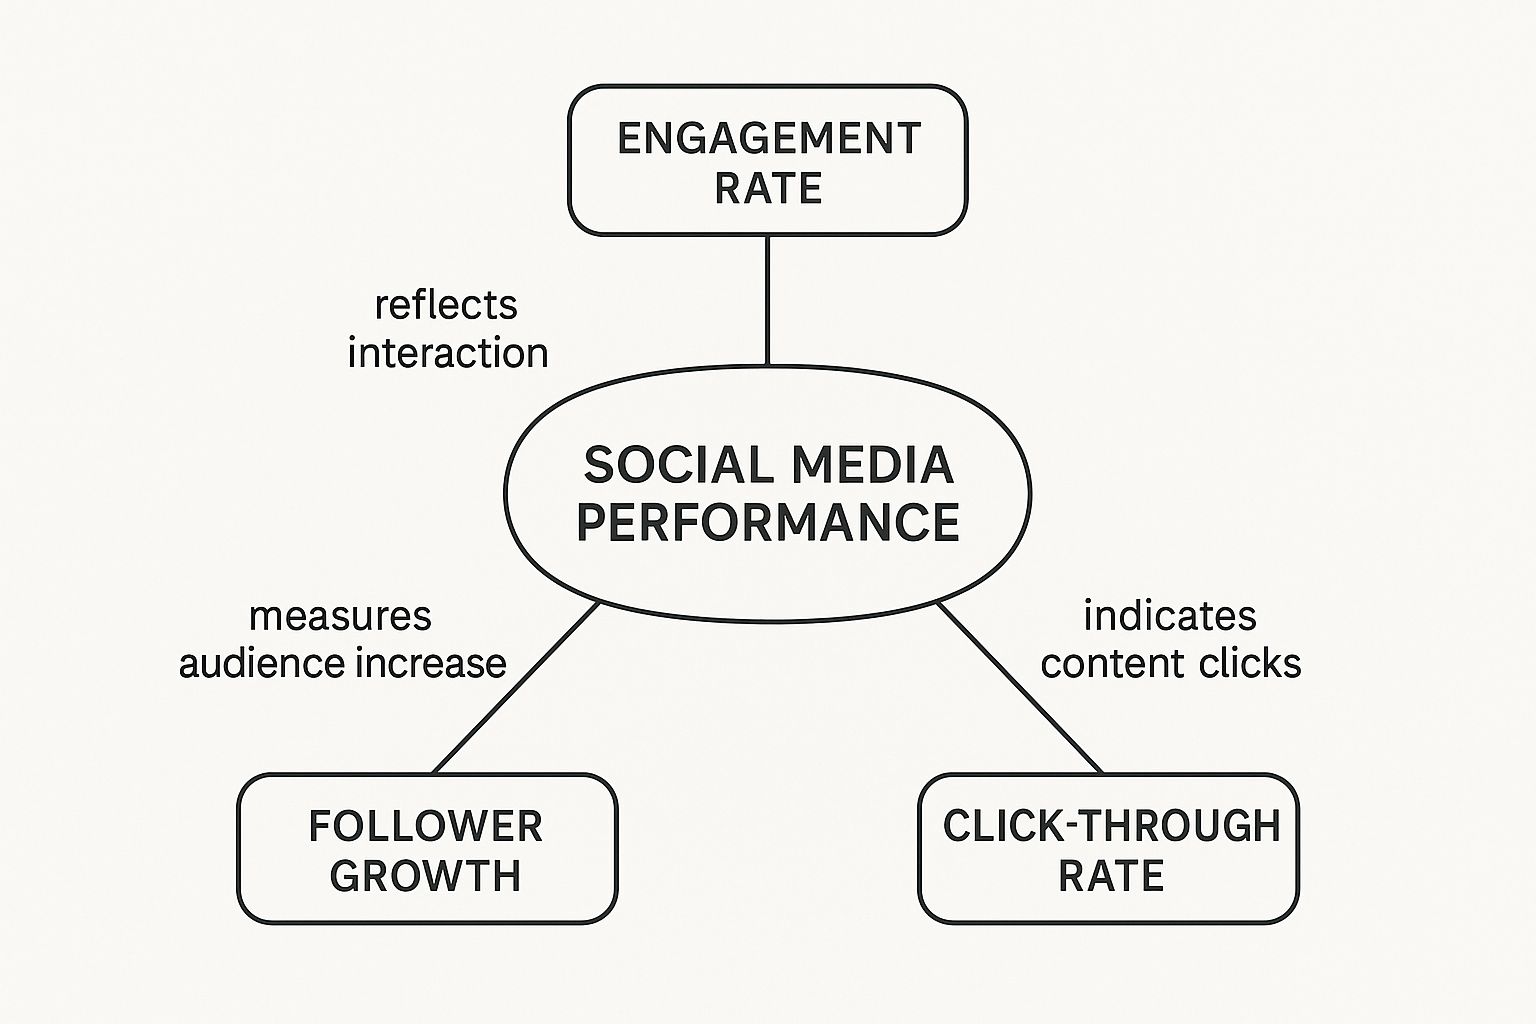
As the graphic shows, you can't just focus on one thing. Strong follower growth is useless without engagement, and high engagement doesn't help your business if it never leads to a click or a sale.
H3: Conversion Metrics: Did Your Social Media Efforts Actually Work?
Finally, we get to the metrics that your boss really cares about: Conversion Metrics. These are your GPS. They tell you if you've actually arrived at your business destination.
These are the numbers that connect your social media activity directly to your bottom line.
- Click-Through Rate (CTR): What percentage of people who saw your post actually clicked the link?
- Cost-Per-Click (CPC): If you're running ads, how much did each of those clicks cost you?
- Conversion Rate: Of the people who clicked, how many completed the goal—like buying a product, signing up for a newsletter, or downloading a guide?
A post with thousands of likes is nice for your ego, but if your goal was to drive webinar sign-ups and your CTR was almost zero, was it really a success? These metrics help you make those tough calls and prove the real value of your work.
To help you keep all this straight, here’s a quick-reference table breaking down the most important metrics you'll find in your dashboard.
Key Social Media Metrics and What They Mean
| Metric Category | Specific Metric | What It Measures | Strategic Question It Answers |
|---|---|---|---|
| Awareness | Reach | The number of unique people who saw your content. | How big is my actual audience? |
| Awareness | Impressions | The total number of times your content was viewed. | How visible is my content overall? |
| Engagement | Engagement Rate | The percentage of your audience that interacted with a post. | Does my content resonate with my audience? |
| Engagement | Likes/Comments/Shares | Specific user interactions on a piece of content. | What types of content drive the most interaction? |
| Conversion | Click-Through Rate (CTR) | The percentage of viewers who clicked a link in your post. | Is my call-to-action compelling enough? |
| Conversion | Conversion Rate | The percentage of link-clickers who completed a desired action. | Is my social media activity driving real business results? |
Looking at these metrics together gives you a complete picture. You can see how many people you reached, whether they engaged with your message, and if that engagement ultimately led to a meaningful business outcome. That’s the real power of a social media analytics dashboard.
Building Your First Analytics Dashboard
Putting together your first social media analytics dashboard isn't really a data science project—it's more like being an architect. Your goal is to assemble the right pieces in the right order to build something that serves a clear purpose. And it doesn't start with data. It starts with a simple question: what business goal are you trying to hit?
Before you even think about connecting a single account, you need to define what success looks like for you. Are you trying to grow brand awareness? Drive more traffic to your website? Or maybe generate more leads? Each of these goals requires a totally different set of metrics to watch.
This "goal-first" mindset saves you from building a dashboard cluttered with vanity metrics—those flashy numbers that look great on paper but don't actually move the needle for your business.
Choosing Your Dashboard Pathway
Once you’ve got your goals locked in, you can decide how you’re going to build your dashboard. You’ve really got three main options, and each one fits different needs and resources.
- Native Platform Tools (The DIY Starter Kit): Every major social platform—from Meta Business Suite to YouTube Analytics—has its own free, built-in analytics tools. These are fantastic when you’re just starting out. You get essential data straight from the source without spending a dime.
- Third-Party Platforms (The All-in-One Solution): Tools like Sprout Social or Hootsuite pull data from all your social networks into one place. This is the way to go if you’re managing several channels and need to see the bigger picture with cross-platform insights and automated reports.
- Custom-Built Solutions (The Bespoke Blueprint): For ultimate control, you can use data visualization software like Looker Studio or Tableau to build a dashboard from scratch. This path offers the most flexibility, but it does require a bit more technical know-how to pull data from various APIs.
If you’re leaning toward a custom build and want to get the visualization just right, this developer's guide to building a custom social media analytics dashboard is a goldmine of information.
Assembling Your Dashboard Step by Step
No matter which path you take, the setup process is pretty logical. Think of it as connecting the dots between your goals and your data.
First, you'll need to securely connect your social media accounts to whatever tool you've chosen. This gives the platform permission to start pulling in your performance data automatically.
Next up, you’ll pick the Key Performance Indicators (KPIs) that tie directly back to the business goals you set earlier. If your goal is brand awareness, you’ll want widgets for Reach and Impressions front and center. If it’s sales you’re after, you’ll highlight your Click-Through Rate (CTR) and Conversion Rate.
The best social media analytics dashboards are a mirror of your strategy. They should visually shout about the data that helps you make decisions, while pushing the less critical metrics into the background.
This kind of strategic customization is everything. A great dashboard tells you a story at a glance. You can get a better handle on structuring that story by checking out these data visualization best practices. By arranging the layout to put your most important KPIs right at the top, you see what matters most, instantly.
It's no surprise that demand for these tools is skyrocketing. The global social media analytics market was valued at USD 10.23 billion in 2024 and is on a steep upward climb. Businesses are realizing they need help making sense of massive datasets to stay competitive.
Ultimately, your dashboard should be a living, breathing tool, not some dusty, static report. It’s your command center for understanding what’s working and deciding what to do next.
Turning Raw Data Into Actionable Insights
Let’s be honest: raw data is just noise. It's a jumble of numbers and stats that doesn't mean much on its own. A great social media analytics dashboard is what helps you find the story hidden inside that noise, turning confusing figures into a clear strategy.
Think about it this way. Your dashboard might show you got 40% more shares on video posts last month. That’s an interesting data point, but it's not an insight... yet.
The real magic happens when you ask, "Okay, so what?" Why did those videos connect so well with our audience? Was it the topic? The format? The time we posted? Answering that simple question is how you move from just looking at data to actually acting on it.
Visual Reports Make the Story Clear
A quick glance at a chart can tell you more than a spreadsheet ever could. Visuals immediately highlight the peaks and valleys, so you can spot a sudden drop in engagement or a huge spike in click-throughs without digging for hours.
Think of it as your data’s EKG. You can instantly see where things are healthy and where they need attention.
- Spotting Trends: See if your follower count is on a steady climb or if a specific content type is starting to lose steam.
- Finding Anomalies: Notice that one post that went viral overnight? Or the week when engagement mysteriously tanked? Visuals make these stand out.
- Triggering Action: When you see a clear pattern, you know exactly what to do next.
Frameworks For Analyzing Your Data
Instead of just staring at numbers, it helps to have a structured way to approach them. Comparing trends over time is a classic for a reason—it shows you what’s changing. Is this month better than last month? What about this quarter versus last year?
Correlation analysis is another powerful tool. This is where you connect the dots between two different metrics. For example, you can see if posting more frequently actually leads to more reach, or if it just burns out your audience.
Here’s a simple process to follow:
- Start with a hypothesis, like "I think our audience engages more with behind-the-scenes photos."
- Pull the relevant numbers from your dashboard to check it.
- Compare different time periods to see if your idea holds up.
- Based on what you find, plan your next content experiment.
Getting your team into this rhythm turns social media management from a guessing game into a data-driven science.
“A dashboard isn’t just about reporting the past. It’s your roadmap for tomorrow.”
Spotting Patterns With Visual Tools
Modern dashboards are more than just static charts. Interactive tools let you slice and dice your data to find hidden gems. You can filter by channel, date, or content type to get super specific.
Heat maps are fantastic for pinpointing the exact hours your audience is most active. Scatter plots can show you the relationship between your ad spend and your conversions, helping you justify your budget.
And sometimes, a simple table is all you need to get straight to the point.
| Metric | What It Shows | Actionable Question |
|---|---|---|
| Engagement Rate | How deeply your audience is interacting. | Should we create more of our high-engagement formats? |
| CTR | How well your links are performing. | Which posts are actually driving people to our website? |
| Follower Growth | How quickly your audience is expanding. | What did we do differently when our growth accelerated? |
This kind of layout helps you scan the most critical information without getting lost in the weeds.
Practical Examples That Drive Strategy
Let’s make this real. Imagine your reach dropped by 25% the week you launched a new product. That’s a disaster, right?
But then you look at your dashboard and cross-reference your posting times with your audience activity data. You realize you pushed all the launch content live while your target audience was asleep.
The action becomes obvious: reschedule future launch posts to align with when your followers are actually online.
Here's another quick case study:
- A new video series you launched got 50% more comments than any other content.
- Your overall engagement rate jumped from 3% to 7% within two weeks.
- The Insight: Your audience is hungry for deeper, more narrative-driven content.
- The Action: You decide to make video storytelling a core part of your strategy for the next quarter.
Use these kinds of scenarios to train your brain to look for the "why" behind the numbers.
Turning Insights Into Ongoing Action
Your dashboard shouldn't be something you check once a month. It should be the engine of an ongoing cycle of improvement.
- Monitor your KPIs every day.
- Diagnose any strange dips or spikes using your audience data.
- Apply targeted adjustments to your content or schedule.
- Review the performance of those changes weekly.
This loop keeps your strategy fresh and ensures you're constantly optimizing, not just coasting.
Deep Dive Into Content Performance
To really master this cycle, you need to measure every piece of content against a clear set of standards. Track shares, comments, saves, and conversions side-by-side to see what truly resonates.
For a more detailed breakdown of how to do this, check out our complete guide on Measuring Content Performance in Social Media.
When you treat your dashboard as an active tool for making decisions, you turn data from a chore into your biggest competitive advantage.
How to Choose the Right Dashboard Tool
With dozens of platforms vying for your attention, picking the right social media analytics dashboard can feel overwhelming. The trick isn’t in finding a mythical “best” option—it’s in matching a tool to your unique needs, budget, and stage of growth.

Think of it as choosing transportation. A freelancer might be fine with a nimble scooter, a growing agency needs a reliable SUV, and an enterprise demands a fleet of heavy-duty trucks. Each serves a different purpose—so does every dashboard.
Assess Your Business Needs First
Before diving into features, nail down what you really want to achieve. Are you building a community on a single channel, or juggling multi-platform campaigns for multiple clients?
Ask yourself:
- What’s my primary goal? Brand awareness, lead generation, customer support?
- How many accounts will I track? Ten profiles across five networks aren’t the same as one Instagram page.
- What’s my budget? Be honest about monthly or annual spend.
- Who’s using it? A solo consultant has different needs than a five-person marketing team.
Answering these questions draws clear lines around what you actually need—so you won’t get dazzled by fancy bells and whistles you’ll never use.
Tier 1: The Free Native Platforms
For anyone just getting started, the built-in analytics from Meta Business Suite or YouTube Studio are unbeatable. You get direct data on reach, engagement, and audience demographics without spending a dime.
However, you’ll need to toggle between platforms to get the full picture. And if you dream of automated reports or competitive benchmarking, you’ll quickly hit their limits.
Tier 2: All-in-One Social Media Suites
Once you outgrow single-platform metrics, consider an all-in-one hub like Hootsuite or Sprout Social. These solutions pull your data from multiple networks into a unified interface.
They shine in:
- Automated report generation
- Competitor tracking
- Content scheduling and approval workflows
- Team collaboration tools
On top of that, seeing Instagram and LinkedIn performance side by side offers strategic insights you can’t get from native dashboards.
The real power of an all-in-one suite is connecting the dots across channels, not just collecting isolated stats.
Tier 3: Specialized Analytics Powerhouses
If your operation is data-intensive—think large enterprises or agencies handling dozens of brands—you’ll need deeper insights. Tools like Brandwatch or NetBase Quid offer advanced social listening, sentiment analysis, and predictive forecasting.
By 2025, social media users will top 5.24 billion, and platforms such as TikTok average 2.5% engagement compared to Instagram’s 0.5%. These specialized dashboards are built to process huge datasets and decode emerging trends. For more market context, see the global social media analytics market on Mordor Intelligence.
Ultimately, it boils down to aligning a tool’s depth with your strategic goals.
Comparison of Social Media Analytics Dashboard Tools
Below is a quick reference comparing popular analytics dashboards by ideal users, standout features, and pricing structure.
| Tool Name | Best For | Key Features | Pricing Model |
|---|---|---|---|
| Meta Business Suite | Solo platforms | Native metrics, post scheduling | Free |
| YouTube Studio | Video-centric creators | Watch time analytics, audience demographics | Free |
| Hootsuite | Small to mid-size teams | Multi-platform dashboard, automated reports | Subscription from $49/mo |
| Sprout Social | Agencies & growing businesses | Competitor tracking, content calendar | Subscription from $99/mo |
| Brandwatch | Enterprise-level analytics | Sentiment analysis, social listening | Custom pricing |
| NetBase Quid | Data-heavy enterprises | Predictive insights, trend detection | Custom pricing |
Use this snapshot to identify which tier aligns with your needs, team size, and budget.
Ultimately, choosing the right social media analytics dashboard comes down to matching a tool’s capabilities with your business objectives. Start with clear goals, fit them to the right tier, and you’ll land on a solution that delivers real value.
Common Questions About Analytics Dashboards
Even after you get the hang of what a social media analytics dashboard is for, a few common questions always seem to pop up. Let's tackle them head-on.
Think of this section as your quick-reference guide. We’ll clear up the common sticking points we hear from marketers and business owners all the time—from how often you should be checking your numbers to whether those free tools are really cutting it.
How Often Should I Check My Dashboard?
Honestly, there’s no single right answer here. How often you peek at your dashboard really hinges on what you’re trying to accomplish. You can think about it in a few different tiers.
During a big campaign or a product launch, a daily check-in is non-negotiable. It’s a quick, five-minute look to make sure everything is on track, spot any red flags before they blow up, and tweak your ad spend on the fly.
For a more strategic view, a weekly review is usually the sweet spot. This is your chance to see broader trends without getting lost in the weeds of daily ups and downs. It's the perfect time to ask, "What was our best-performing content last week, and what can we learn from it?"
Then there’s the monthly or quarterly review. This is your big-picture moment. You’ll zoom out to track progress against your long-term business goals, build your report for stakeholders, and make smart decisions for the next period.
At the end of the day, it's less about the exact frequency and more about consistency. Whether it's daily or weekly, make checking your dashboard a real habit.
What Is the Single Most Important Metric to Track?
I'm going to be blunt: this is a trick question. There isn't one "most important" metric. The metric that matters most is always the one that connects directly to your current business goal.
Chasing a single number without context is a trap many people fall into. Instead, you need to identify the Key Performance Indicator (KPI) that tells you if you're actually succeeding at what you set out to do.
It breaks down like this:
- Goal: Brand Awareness? Then your north star metrics are Reach and Impressions. The only question you should be asking is, "How many eyeballs are we getting on our content?"
- Goal: Community Building? You need to be obsessed with your Engagement Rate. Your focus should be on, "Are people actually talking back to us and interacting in a meaningful way?"
- Goal: Driving Sales? Then forget the vanity metrics. The numbers that matter are Conversions and Click-Through Rate (CTR). You have to answer, "Are people clicking, and are those clicks turning into actual sales?"
A great dashboard will let you customize your view so that your goal-aligned KPI is front and center. You shouldn't have to go digging for the number that truly matters.
Can a Dashboard Truly Measure Social Media ROI?
Yes, absolutely. But it takes a little setup work. A dashboard by itself just shows you what's happening on social media. To measure Return on Investment (ROI), you have to connect that social activity to a real business outcome.
The secret is building a bridge between your social channels and your website. This is almost always done with tracking links, like UTM parameters. These little tags tell your website analytics exactly where your traffic is coming from.
When you have that set up correctly, your dashboard can show you that a specific LinkedIn post didn't just get likes—it drove 50 website visits, generated 10 leads, and resulted in 2 sales. Now you can do the math: compare the revenue from those sales to what you spent on the campaign (ad costs, tools, your time). Suddenly, your dashboard isn't just a performance tracker; it's a tool that proves the financial impact of your work.
Are Free Analytics Dashboards Good Enough?
For someone just starting out, or a small business dipping its toes in the water, the free tools are fantastic. The native dashboards from Meta Business Suite or YouTube Studio give you all the basic data you need to understand your audience and see what content hits the mark. They're the perfect starting line.
But as your strategy gets more sophisticated and you're active on more channels, you’ll quickly feel the walls closing in on what those free tools can do. Paid solutions offer a few game-changing advantages that you'll eventually need.
Here are the main differences:
- Cross-Platform Reporting: Paid tools pull all your data from LinkedIn, Instagram, TikTok, you name it, into one place. This saves a mind-numbing amount of time you'd otherwise spend hopping between tabs.
- Automated Reports: You can set up custom reports to automatically land in your boss's inbox every Monday morning. No more manually building spreadsheets.
- Advanced Insights: Premium dashboards unlock much deeper insights, like tracking what your competitors are doing, analyzing the sentiment of comments, and listening in on broader industry conversations.
So yes, start with the free tools. But if you're serious about growing your social media presence and proving its value, investing in a dedicated dashboard is a necessary next step.
Ready to turn your content into visually stunning, high-engagement carousels? Lumeo uses AI to help you create compelling presentations from any text, video, or article, optimized for platforms like LinkedIn and Instagram. Start building a stronger digital presence today.