Measuring Content Performance: What Actually Works in 2025

What Really Matters in Measuring Content Performance
This screenshot shows a typical Google Analytics dashboard. It highlights some key metrics like user acquisition and behavior. Just a quick look gives you valuable data points on where your traffic is coming from and how users interact with your content. This is gold for figuring out what’s working and what needs a little love.
Let's be real, a lot of content teams are drowning in data, but are parched for actionable insights. I've seen it firsthand working with content pros: everyone’s tracking everything, but few truly understand what moves the needle. So, let's ditch the noise and focus on the metrics that actually impact your bottom line.
Beyond Vanity Metrics
Vanity metrics – things like page views and follower counts – can be tempting. We all like to see big numbers! However, they often don’t tell the whole story, especially when it comes to your business goals.
For example, a blog post could rack up thousands of views. Sounds great, right? But if none of those viewers convert into leads or customers, the impact is minimal. It's like a crowded stadium with no one buying tickets.
Metrics That Move the Needle
Instead of vanity metrics, prioritize the ones that directly align with your objectives. If your goal is lead generation, zero in on metrics like conversion rates, form submissions, and email sign-ups. These are the actions that directly contribute to growth.
If your goal is brand awareness, track things like social shares, mentions, and backlinks. These metrics paint a clearer picture of how your brand is resonating within your target audience. Understanding the user journey – how people interact with your content across different touchpoints – is also essential. It's like mapping out their experience, from discovery to conversion.
This focus on data-driven strategies is a global trend. In 2025, organic search traffic will remain a highly valuable metric. Tracking organic search is crucial for assessing how effective your SEO is and understanding which content truly resonates with your audience. Studies show that top-performing websites in competitive industries can see upwards of 60% of their traffic from organic search. That's a huge chunk! This makes it essential for long-term visibility and growth. It highlights the strategic importance of measuring and optimizing organic search performance, especially since content marketing budgets are projected to continue rising globally. About 46% of B2B marketers anticipate budget increases in 2025. Discover more insights.
Finally, remember that context is king. A high bounce rate might seem like a red flag. But it could also mean your content is efficiently answering user questions, leading them to leave satisfied. So, always consider all the relevant factors when interpreting your data. Don't jump to conclusions!
Building Your Analytics Foundation (Without the Headaches)
I've seen so many content teams get tangled up in overly complicated analytics setups. It's a real pain, and honestly, the best systems aren't the ones with all the bells and whistles—they're the ones you actually use. So, let's keep it practical. We'll explore the core tools and setups that content pros rely on, from hidden gems within Google Analytics to specialized platforms that deliver serious insights.
One thing I've learned: you need a solid understanding of marketing measurement in general before diving into content specifics. A great resource for this is Big Moves Marketing's guide on how to measure marketing success. It gives you a helpful overview of what to track and why. We'll also talk about which free tools can handle the bulk of your needs (I'm talking 90%) and when it makes sense to invest in premium options. Even more importantly, I'll share some common setup mistakes that can mess with your data (and the easy fixes to get things back on track).
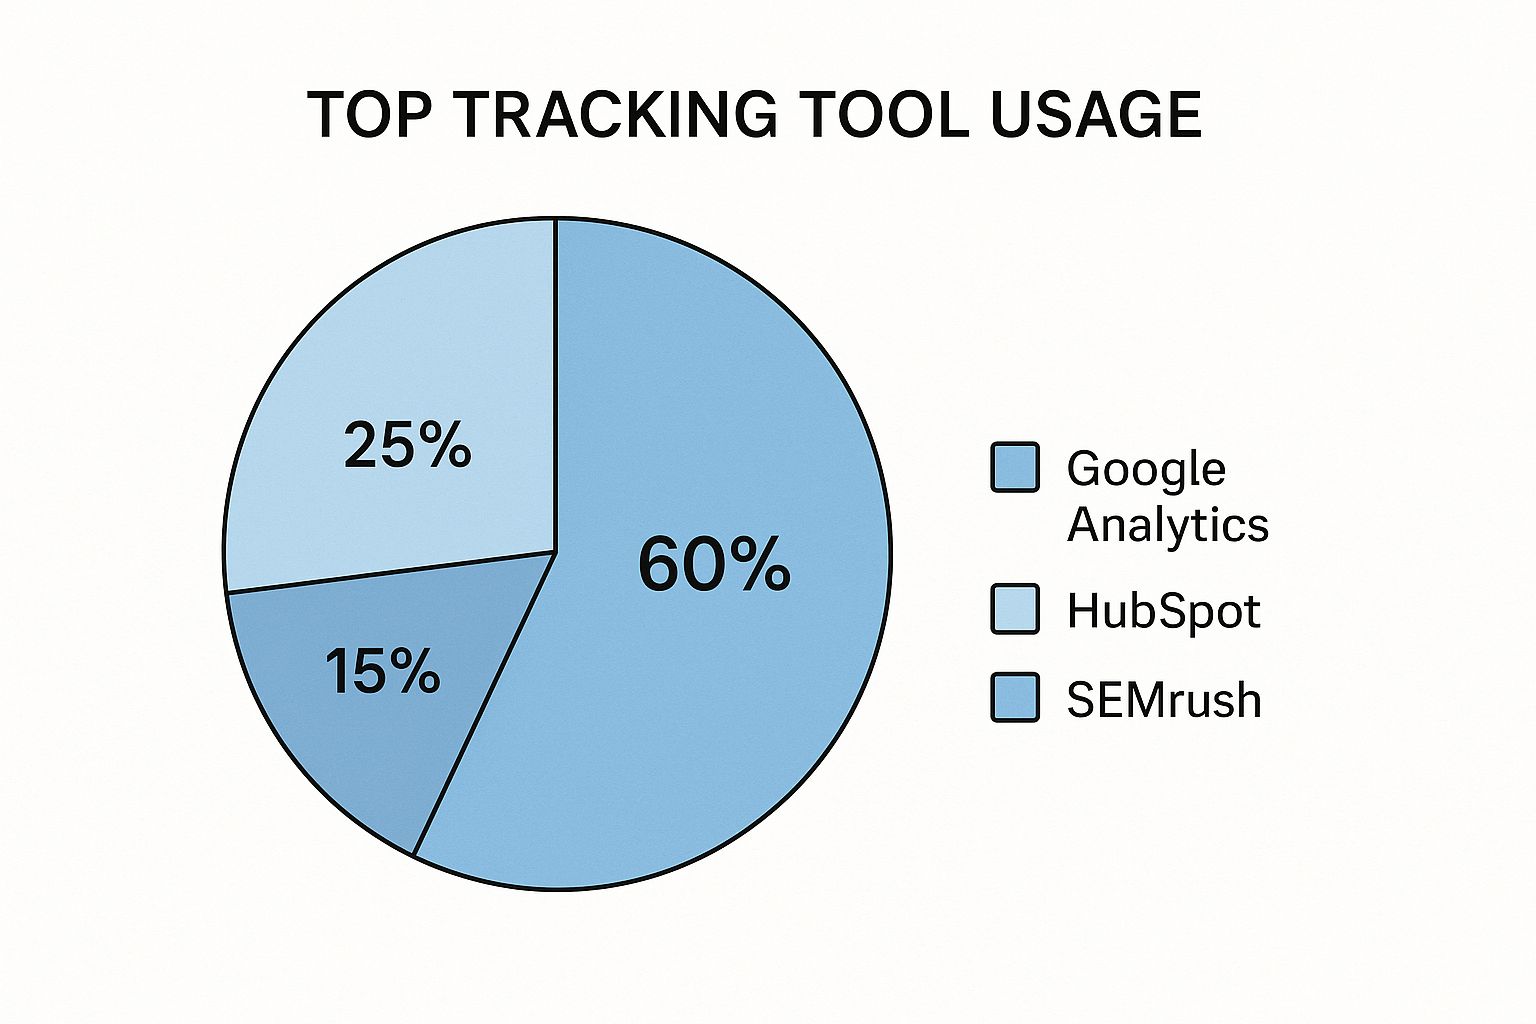
This infographic shows the current landscape of content tracking tools. Notice how Google Analytics still dominates, with a 60% share, followed by HubSpot at 25% and SEMrush at 15%. This just reinforces how vital it is to master Google Analytics if you're serious about content measurement.
Here’s a peek at the Google Analytics setup screen. This is where you configure the foundation of your tracking – what data is collected and how it's organized. Getting this right from the start will save you headaches later.
Essential Tools and Configurations
Let's ditch the data scientist act – this isn't about complicated analysis. It's about using the data you already have smartly. We'll look at real examples from different-sized content teams and how they organize data to fit their workflows and reports. For example, setting up custom dashboards in Google Analytics can give you a snapshot of your most important metrics. This saves tons of time and effort. Another tip: integrating your analytics with other marketing tools (like your CRM) can streamline your entire process. Think about it: you can track the full customer journey, from first click to conversion, all in one place.
To help you choose the right tool for your needs, I've put together a comparison table of some popular content analytics platforms. It highlights the key features, pricing, and best-use cases for each.
Essential Content Analytics Tools Comparison
| Tool | Key Features | Best For | Price Range | Setup Complexity |
|---|---|---|---|---|
| Google Analytics | Website traffic analysis, content engagement metrics, conversion tracking | Beginners, small to medium businesses | Free | Easy |
| HubSpot | Marketing automation, CRM integration, content performance analysis | Medium to large businesses, marketing teams | Freemium, paid plans starting at $450/month | Moderate |
| SEMrush | SEO and content marketing tools, competitor analysis, keyword research | SEO professionals, digital marketing agencies | Paid plans starting at $119.95/month | Moderate |
| Parse.ly | Content analytics for publishers, real-time data, audience engagement metrics | Large publishers, media companies | Custom pricing | Complex |
This table gives you a starting point for evaluating which platform might be the best fit for your specific content measurement needs. While Google Analytics offers a robust free option, platforms like HubSpot and SEMrush provide more advanced features for a price. For larger publishers, Parse.ly focuses on real-time data and audience insights. Choosing the right tool is crucial for getting the data you need to make informed content decisions.
Decoding Engagement: Beyond Likes and Shares

This screenshot from SproutSocial shows the range of social media metrics marketers use. It really highlights how much data there is to consider when evaluating content performance. Seeing all these metrics laid out like this emphasizes the importance of digging deeper than just likes and shares to truly understand engagement.
I've looked at mountains of content data, and honestly, engagement is consistently the most misunderstood metric in content marketing. So many people focus on chasing likes and shares, but the teams actually driving business results are looking at something entirely different. Let's explore the engagement signals that actually predict business outcomes, from social media interactions that convert to on-page behaviors that show genuine interest.
Engagement Signals That Matter
Here are a few crucial engagement metrics that often fly under the radar, but pack a serious punch:
Dwell Time: How long are people sticking around and actually reading your content? High dwell time is a strong indicator that people are finding your content valuable.
Scroll Depth: Are people scrolling all the way down the page? This shows they are truly engaged and absorbing what you've created.
Return Rate: How often are visitors returning to your site? A good return rate signifies you are building a loyal audience who appreciate your content.
Click-Through Rate (CTR): Are people clicking on your calls to action? This metric measures how effective your content is at getting your audience to do what you want them to do.
Beyond these, think about the quality of comments and shares. Are people just dropping emojis, or are they participating in meaningful discussions? Are they sharing your content with people who are likely to become customers? This qualitative information can be just as important as the numbers themselves.
Beyond Viral Moments: Building Sustained Engagement
In my experience, you'll likely find content with minimal social engagement that still drives significant business results. And, on the flip side, a piece that goes viral might not move the needle on your bottom line at all. Why? Because viral moments are temporary. Sustained audience building is what creates lasting value. Engagement metrics – specifically social shares, likes, comments, and saves – are another key pillar of content performance measurement. Research shows these interactions are direct indicators of content quality and relevance. Even for standard business content, a good engagement rate typically falls between 1% and 3%. Learn more about social media metrics. The real trick is interpreting that engagement data within its proper context. Learn to recognize the difference between a viral spike and true sustained engagement, then use those patterns to refine your content strategy.
Focusing on these deeper engagement metrics gives you real insights into what kind of content resonates with your audience and how they actually interact with it. This, in turn, lets you craft future content for maximum impact, driving not just engagement, but real, tangible business results.
Connecting Content to Revenue (The Part That Matters Most)
Let’s be honest, I've seen some truly amazing content strategies fail miserably. Why? Because they weren’t tied to actual business outcomes. It’s like making a gorgeous cake and then letting it sit there uneaten. Looks fantastic, but what's the point? So, let's talk about how to track how your content actually influences conversions, from simple attribution models to more complex approaches like customer journey mapping.
Tracking Conversions: The Practical Approach
Think of conversion tracking as leaving a trail of digital breadcrumbs to follow your customers' journey. It’s about understanding how people interact with your content and how it leads to desired actions. We'll explore how to implement tracking that truly captures the impact of your content. This includes getting a handle on multi-touch attribution. Why is this important? Because multi-touch attribution recognizes that content plays a supporting role, sometimes over long periods. You might publish a blog post today that influences a sale two years down the line. Multi-touch attribution helps you see that connection.
Here’s a quick look at the Conversions Overview in Google Analytics:
This overview gives you a bird’s-eye view of how your conversion goals are performing. Take a look at how goal completions are trending – are they increasing, declining, or flatlining? This dashboard becomes your starting point for investigating why those trends are happening. Digging into the data can uncover hidden gems of insight.
For more strategies to boost your business growth, check out this guide on LinkedIn content strategies.
One of the most critical metrics, of course, is your conversion rate – the percentage of visitors who complete a specific action. Top-performing websites often see conversion rates between 2% and 5%, with some even hitting 10% in highly optimized campaigns. Studies show that the right tools can boost these rates by 20% or more each year. Want to dive deeper into content measurement? Here’s a great resource.
Measuring ROI and Optimizing Your Content Funnel
Let’s talk about how successful teams actually measure ROI. It’s not just about the dollars and cents; it’s also about understanding which pieces of content drive the most valuable actions. A blog post, for instance, might not directly generate leads, but it could be essential for bringing people into your content funnel. Effective social media engagement is crucial for getting the right eyes on your content. To learn more about maximizing your reach, you can explore strategies to boost social media engagement. From there, other content (like case studies or webinars) can nurture those leads and move them closer to converting.
Now, to help you understand industry standards and where you might focus your optimization efforts, let’s look at some benchmarks.
Content Conversion Benchmarks by Industry
| Content Type | Industry | Average Conversion Rate | Top Performer Range | Key Optimization Factors |
|---|---|---|---|---|
| Landing Pages | E-commerce | 2.5% | 10-12% | Clear call to action, compelling visuals, mobile optimization |
| Blog Posts | B2B SaaS | 2% | 5-7% | Engaging content, relevant lead magnets, strong SEO |
| Email Campaigns | Financial Services | 1.5% | 4-6% | Personalized messaging, targeted segmentation, A/B testing |
| Social Media Ads | Travel & Hospitality | 1% | 3-5% | Compelling visuals, targeted demographics, retargeting campaigns |
As you can see, conversion rates vary significantly by industry and content type. Focusing on key optimization factors can help you move into the top performer range.
Advanced Techniques: Cohort Analysis and Lifetime Value Attribution
Want to get even more sophisticated? Cohort analysis helps you identify long-term trends. Imagine grouping customers based on when they first interacted with your content. Then, track how their behavior (engagement and purchases) evolves over time. This can reveal powerful insights into how your content resonates with different groups and how to tailor your strategy.
Then there’s lifetime value attribution. This takes a long-term perspective, recognizing that a single piece of content can influence a customer's overall value to your business throughout their entire relationship with your brand. It's about understanding the enduring impact of your content.
Reading Between the Lines: Advanced Data Interpretation
Raw data is just a starting point. The real value comes from understanding what it means. I’ve seen content teams make major decisions based on superficial metrics, totally overlooking the underlying story their data is telling. Let’s dive into some more nuanced analysis techniques that help you separate the meaningful insights from the noise.
Cohort Analysis: Spotting Long-Term Trends
Cohort analysis is like grouping your audience into graduating classes based on when they first interacted with your content. Think about tracking the group that first engaged with you in January 2024. You’d follow their behavior over time, noting their engagement, purchases, anything relevant. This reveals how specific groups behave in the long run, giving you powerful insights into long-term trends. For instance, you might discover one cohort has a much higher lifetime value. That could indicate a specific campaign or piece of content really hit the mark with that group.
Attribution Modeling: Understanding How Content Works Together
Content rarely exists in a vacuum. A customer’s journey usually involves many touchpoints. Attribution modeling helps you figure out how different pieces of content contribute to conversions. Rather than giving all the credit to the last piece of content a customer interacted with before buying something, you can spread the love across all the content that played a part. This gives a much clearer picture of how your content works together. For example, a blog post might initially introduce a potential customer to your brand, and then a social media post later encourages them to subscribe to your newsletter. Attribution modeling shows the value of both pieces.
This screenshot shows the report gallery in Google Data Studio. You can use this to create custom dashboards for measuring content performance. Imagine seeing all your data, from different sources, in one convenient place. This kind of setup is incredibly powerful for figuring out which channels and campaigns actually drive the most engagement and conversions.
Identifying Patterns and Emerging Trends
Effective data interpretation isn't just about looking at individual metrics; it’s about spotting the larger patterns and emerging trends. For example, a consistent increase in engagement with a certain type of content? That’s a valuable clue, suggesting you should double down on that kind of content. Tools like Google Data Studio are incredibly useful here. You can create custom dashboards to visualize your key metrics and track performance over time.
Statistical Thinking: Avoiding Analytical Traps
One of the biggest mistakes I see people make with data is falling into analytical traps. Confirmation bias, for example, can make you focus only on data that supports your existing beliefs, ignoring anything that contradicts them. Developing your statistical thinking helps you avoid these traps. This involves understanding ideas like correlation and causation. Just because two things happen together doesn’t mean one caused the other. A critical eye for data is essential for making the right content decisions.
By getting comfortable with these analysis techniques, you can unlock the true potential of your content data. This gives you the power to anticipate performance, make smarter content investments, and ultimately hit your business objectives. I’ve even created templates and checklists for you to conduct your own in-depth analysis, no statistics degree required. We'll talk about those soon.
Turning Insights Into Better Content Performance

This screenshot shows the Google Optimize homepage. It's a great visual reminder of how easy it is to start A/B testing and optimizing your content. Just exploring the interface gives you a sense of the possibilities.
Look, most content teams are awash in data but struggle to actually use it. The most successful content programs I've seen are the ones that have cracked the code of turning insights into real improvements. Let's dive into some practical strategies to make that happen.
Content Refresh Tactics: Breathing New Life Into Existing Content
Refreshing existing content is one of the most impactful ways to boost performance. This doesn't necessarily mean a complete rewrite. Sometimes, small changes can yield big results.
For example, I worked with a client whose blog post on "email marketing tips" wasn't getting much traction. We refreshed the intro, added some recent stats, and included a new call to action. The result? A 30% increase in conversions. Not bad for a few tweaks!
You might also find this helpful: 10 Proven Content Repurposing Strategies to Boost ROI
Here are a few other refresh tactics that can work wonders:
- Updating outdated information: Data changes fast, keep your content current.
- Adding visuals: Images, videos, and infographics can make your content more appealing.
- Improving readability: Shorter paragraphs, headings, subheadings, and bullet points make a big difference.
- Optimizing for SEO: Make sure you're targeting the right keywords.
Strategic Pivots: Responding to Audience Behavior
Your analytics can tell you so much about what your audience wants. Pay close attention to metrics like dwell time, bounce rate, and click-through rates. They can reveal important patterns in audience behavior.
For instance, a high bounce rate might indicate your content isn't resonating. Maybe it's too long, too complex, or just not relevant. Use this feedback to shift your content strategy.
I once worked with a SaaS company publishing long, detailed blog posts about product features. Their analytics showed people were scanning for specific information, not reading the entire post. They switched to shorter, more focused posts addressing individual user questions and saw engagement skyrocket.
A/B Testing: Optimizing for Conversions
A/B testing is essential for optimizing conversions. Create two versions of a piece of content with slight variations – a different headline, a different call to action – and see which performs better.
I've seen A/B testing lead to incredible improvements. Even minor changes, like a button color or headline wording, can have a significant impact.
Scaling Successful Content Formats
When you find a content format that works, scale it! If your audience loves video tutorials, create more video tutorials. If webinars are generating leads, host more webinars. Experiment, but when you find a winner, lean into it.
By following these strategies, you can transform your content from data gathering into a powerful growth engine. It’s about making your content work for you.
Your Content Performance Roadmap
So, you want to seriously level up how you measure your content's success? Awesome! Let's get down to brass tacks. You've got the theory, now it's time for a real-world, boots-on-the-ground action plan. I've been in the trenches with content teams of all shapes and sizes, and I've seen firsthand what actually moves the needle. This roadmap I've put together will take you from basic metrics to advanced optimization without turning your team into a bunch of burnt-out zombies. We’ll start with some quick wins and then build towards more sophisticated measurement. You might also be interested in: Optimizing Your LinkedIn Content Strategy for 2025
Prioritize and Conquer
Think of it like building a house. You wouldn't start with the roof, right? Same goes for measuring content performance. Start with the foundation: crystal-clear goals and the right metrics. If your goal is lead generation, zero in on conversion rates. Brand awareness? Track social shares and mentions.
Once you have those nailed down, then you can start exploring the fancier stuff like cohort analysis and attribution modeling. This phased approach prevents overwhelm and builds momentum.
Reporting That Gets Read (and Acted On)
No more reports that collect dust bunnies! I'll share some report templates that actually get attention – concise, visual, and laser-focused on actionable insights. These templates highlight the most critical data, making it easy for stakeholders to grasp the value of your content. Remember, data without action is just noise.
Goal Setting: Aligned With Business Objectives
Your content goals should directly support your big-picture business objectives. I’ll help you create a framework for setting goals that truly matter, aligning your content strategy with the things that actually drive growth. For example, if your company is laser-focused on breaking into a new market, your content should be all about attracting and engaging that particular audience.
Maintenance: Keep Your System Running Smoothly
A measurement system is a bit like a garden—it needs regular tending. We'll create a schedule for routinely checking your data, updating your dashboards, and refining your metrics. This ensures your system stays relevant and up-to-date.
Communication and Culture: Building a Data-Driven Team
Communication is everything. You’ll learn how to share content performance insights with stakeholders in a way that's clear, compelling, and inspires action. We’ll also dive into building a measurement culture that embraces continuous improvement. That means giving your team the power to use data to inform their decisions and always be on the lookout for ways to do things better.
This roadmap isn't just some pie-in-the-sky theory – it's a practical, actionable plan. You’ll get realistic timelines, resource requirements, and success metrics so you can see improvements quickly. Build that momentum for long-term success and create content that delivers serious value. Ready to turn your content into a powerful growth engine? Check out Lumeo and transform your posts into high-impact visual presentations.