10 Essential Social Media Marketing Metrics for 2025
In the crowded digital landscape, a large follower count is no longer the ultimate prize. True social media success lies in understanding the story your data tells. But with countless data points available, which ones actually move the needle? Tracking the right social media marketing metrics is the difference between shouting into the void and building a thriving community that drives real business results.
A vanity metric like 'likes' might feel good, but it doesn't pay the bills or prove strategic value. To justify budgets, refine campaigns, and connect your social efforts to bottom-line goals, you need to focus on data that demonstrates impact. This means moving beyond surface-level numbers to measure how your audience behaves, how your content performs, and how social media contributes to tangible business outcomes like leads and sales. For a deeper dive into the core concepts and understanding which metrics truly matter, consider exploring a guide to making sense of social media marketing metrics.
This comprehensive guide cuts through the noise. We will break down the 10 essential metrics every marketer should track, from engagement and reach to conversion and ROI. For each metric, you'll get a clear definition, actionable tracking tips, industry benchmarks, and practical examples to help you apply these insights immediately. Forget guesswork; this is your blueprint for a data-driven social media strategy that delivers measurable success and proves its value to stakeholders. Let's dive into the numbers that truly matter.
1. Engagement Rate
Engagement rate is one of the most fundamental social media marketing metrics, measuring the level of active interaction your content receives relative to your audience size. It goes beyond simple vanity metrics like follower count to reveal how well your content truly resonates. A high engagement rate indicates a healthy, active community that finds your posts valuable.
How It's Calculated
The standard formula for engagement rate is:
(Total Engagements ÷ Total Followers or Impressions) x 100 = Engagement Rate %
Engagements typically include likes, comments, shares, and saves. Calculating it based on impressions can provide a more accurate picture of how engaging your content is to everyone who saw it, not just your followers.
Industry Benchmarks and Examples
While a "good" rate varies by platform and industry, general benchmarks provide a useful starting point. The following bar chart visualizes typical engagement rate benchmarks across major social platforms.
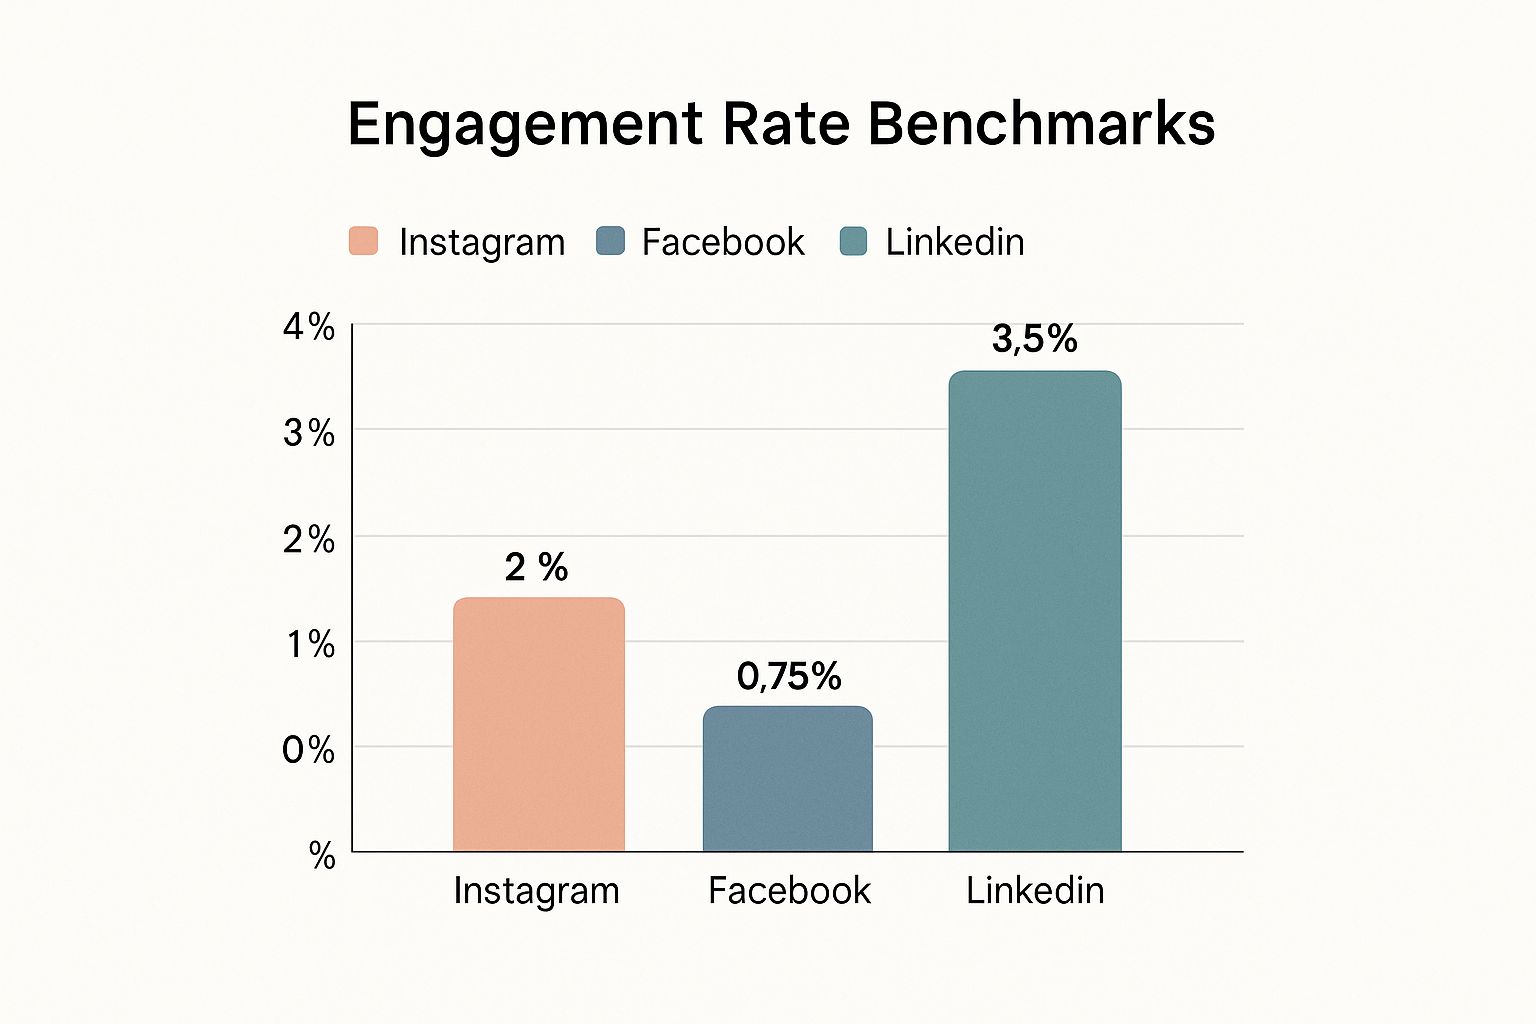
As the chart illustrates, platforms like LinkedIn often see higher engagement due to their professional and niche focus, whereas platforms with broader audiences like Facebook have lower average rates.
- Nike: Despite having over 270 million followers on Instagram, the brand maintains an impressive average engagement rate of 1.5-2% by consistently posting high-quality, inspiring content.
- Wendy's: The fast-food chain’s witty and conversational Twitter presence helps them achieve an exceptional 8-12% engagement rate, proving that tone and personality are powerful drivers of interaction. For a deeper dive into measuring interactions, consider this guide on understanding social media engagement metrics.
Actionable Tips for Improvement
Boosting your engagement rate requires a proactive and strategic approach.
- Time Your Posts: Use your platform’s native analytics to identify when your audience is most active and schedule your content accordingly.
- Encourage Interaction: Directly ask your audience questions, run polls, or create "fill-in-the-blank" style posts to make participation easy.
- Be Responsive: Aim to reply to comments and messages quickly, ideally within a few hours. This signals to both your audience and the platform's algorithm that your account is active and valuable.
2. Reach and Impressions
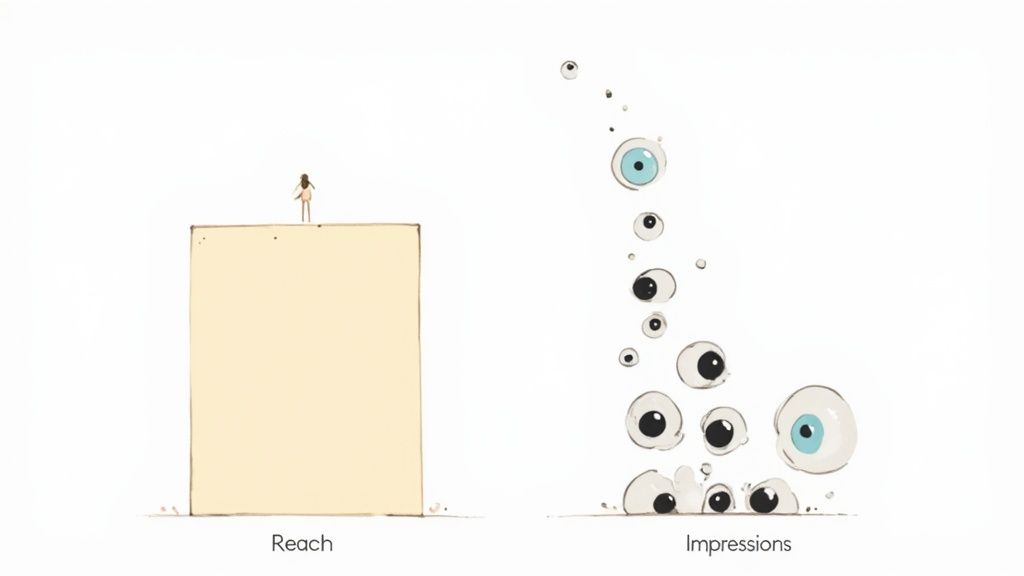
Reach and impressions are foundational social media marketing metrics that measure your content's visibility. Reach refers to the total number of unique people who saw your content, while impressions count the total number of times your content was displayed, which can include multiple views by the same person. These metrics are crucial for gauging brand awareness and the overall scope of your content distribution.
How It's Calculated
These metrics are typically provided directly by the social media platform's native analytics tools. The core distinction is simple:
- Reach: 10 people see your post = 10 Reach.
- Impressions: Those same 10 people see your post an average of 3 times each = 30 Impressions.
A high impression-to-reach ratio suggests your content is being shown repeatedly to the same audience, which can indicate it is sticky or being algorithmically favored.
Industry Benchmarks and Examples
Reach and impressions can vary dramatically based on follower count, content virality, and ad spend. However, successful campaigns demonstrate their potential power.
- Coca-Cola: The iconic #ShareACoke campaign was a masterclass in maximizing visibility, reportedly reaching over 500 million people globally through a blend of user-generated content and strategic media placement.
- BuzzFeed Tasty: The food brand’s shareable, short-form video recipes are designed for virality. A single popular video can easily achieve over 10 million impressions as it spreads across platforms like Facebook and Instagram.
- Airbnb: Leveraging high-quality user-generated and original photography, Airbnb’s Instagram posts regularly reach an organic audience of 200,000 to 500,000 unique users, showcasing the power of visually compelling content.
Actionable Tips for Improvement
Expanding your content's visibility requires a multi-faceted strategy focused on discoverability and consistency.
- Use Relevant Hashtags: Research and use a mix of broad, niche, and branded hashtags to expose your content to new users actively searching for those topics.
- Post Consistently: Maintaining a regular posting schedule keeps your brand top-of-mind and signals to platform algorithms that your account is active, increasing the likelihood of your content appearing in followers' feeds.
- Cross-Promote Your Content: Share your posts across multiple relevant platforms. For example, promote a new YouTube video on your Instagram Stories or share a blog post on LinkedIn to maximize its potential reach.
3. Click-Through Rate (CTR)
Click-Through Rate (CTR) measures the percentage of people who click on a specific link within your post, ad, or bio after seeing it. This metric is a vital indicator of how compelling your call-to-action (CTA) is and how effectively your content persuades your audience to take the next step. A high CTR demonstrates that your messaging and creative are not just seen but are also motivating action, making it a critical social media marketing metric for driving traffic and conversions.
How It's Calculated
The formula for calculating CTR is straightforward and focuses on the ratio of actions to views:
(Total Clicks ÷ Total Impressions) x 100 = Click-Through Rate %
This calculation reveals how many people, out of all who saw your content (impressions), were interested enough to click the link. It's a direct measure of your content's ability to drive traffic from a social platform to an external destination like a website, blog, or landing page.
Industry Benchmarks and Examples
CTR benchmarks can fluctuate significantly based on the platform, ad placement, and industry targeting. For instance, a Facebook feed ad might average a 1% CTR, while a highly targeted LinkedIn ad could achieve 2-4%.
- HubSpot: The B2B marketing giant consistently achieves a 2-4% CTR on its LinkedIn ads by offering high-value, targeted content like ebooks and webinars specifically for marketing professionals.
- ASOS: By leveraging Instagram's shopping features, the fashion brand maintains a steady 1.5-2% CTR on product posts, seamlessly guiding users from discovery to purchase.
- Shopify: The e-commerce platform's educational content on Twitter, which links to in-depth blog posts and guides, regularly sees an impressive 3-5% CTR, proving the power of valuable, non-promotional content.
Actionable Tips for Improvement
Improving your CTR hinges on optimizing your content to be as compelling and clickable as possible.
- Use Compelling CTAs: Use clear, action-oriented language like "Shop Now," "Learn More," or "Download Your Free Guide" to eliminate ambiguity and tell users exactly what to do.
- Test Link Placement: Experiment with placing links in different locations, such as your bio, Instagram Stories (using the link sticker), or directly in posts where allowed. Analyze which placement drives the most clicks for your audience.
- Create Urgency: Incorporate limited-time offers, flash sales, or exclusive content access to motivate immediate clicks. Phrases like "For 24 hours only" can dramatically increase CTR.
4. Conversion Rate
Conversion rate is one of the most critical social media marketing metrics for measuring return on investment (ROI). It tracks the percentage of users who take a specific, desired action after clicking a link in your social media post. This action could be making a purchase, signing up for a newsletter, or downloading a resource, directly connecting social media efforts to business goals.
How It's Calculated
The formula for conversion rate is straightforward and directly ties social media clicks to business outcomes:
(Total Conversions ÷ Total Clicks) x 100 = Conversion Rate %
For instance, if a link in your tweet received 500 clicks and resulted in 25 newsletter sign-ups, your conversion rate for that tweet would be 5%. Proper tracking is essential for an accurate calculation.
Industry Benchmarks and Examples
Conversion rates can vary dramatically based on the industry, offer, and audience. However, looking at successful examples provides a clear picture of what's possible when social media strategy is aligned with conversion goals. For a deeper analysis, exploring different types of social media metrics to track can offer valuable context.
- Dollar Shave Club: During its initial launch, the brand reportedly achieved a remarkable 12% conversion rate from its social media traffic, turning viral video views into paying subscribers.
- Mailchimp: The email marketing platform often sees conversion rates around 15% from its social media campaigns for free trial sign-ups, effectively turning social followers into product users.
- Warby Parker: The eyewear company successfully converts 8-10% of its Instagram traffic into home try-on appointments by seamlessly integrating product discovery with a clear call to action.
Actionable Tips for Improvement
Improving your conversion rate involves creating a frictionless path from a social post to the final action.
- Set Up UTM Tracking: Use UTM parameters on all your social media links to accurately attribute which platform, campaign, and post is driving conversions in your analytics software.
- Create Dedicated Landing Pages: Send social media traffic to a specific landing page that matches the messaging and offer from your post. A generic homepage visit is far less likely to convert.
- Use Retargeting Pixels: Install tracking pixels (like the Meta Pixel or TikTok Pixel) on your website. This allows you to create custom audiences of users who visited but didn't convert, so you can serve them targeted follow-up ads.
5. Cost Per Click (CPC)
Cost Per Click (CPC) is a vital paid advertising metric that measures the price you pay for each individual click on your social media ad. This metric is a cornerstone of evaluating paid campaign performance, as it directly connects your advertising spend to a specific user action: clicking through to your landing page or profile. Tracking CPC is essential for understanding your ad efficiency and optimizing your budget for maximum return.
How It's Calculated
The formula for calculating CPC is straightforward and powerful:
(Total Ad Spend ÷ Total Number of Clicks) = Cost Per Click ($)
For example, if you spent $200 on a campaign and it generated 400 clicks, your CPC would be $0.50. This calculation helps you determine the cost-effectiveness of different ads, platforms, and targeting strategies, making it a critical component of social media marketing metrics.
Industry Benchmarks and Examples
CPC can vary dramatically based on the platform, industry, and target audience's competitiveness. Understanding typical benchmarks helps you set realistic goals and evaluate your own campaign performance against the competition.
- B2B SaaS: Companies in this space often see a CPC between $2.00 and $5.00 on LinkedIn, where they can target specific job titles and industries with high precision.
- E-commerce Brands: On Facebook, e-commerce retailers frequently achieve a CPC in the $0.50 to $1.50 range by leveraging dynamic product ads and retargeting engaged shoppers.
- Fashion Retail: For fashion brands running Instagram shopping campaigns, CPCs are often lower, typically falling between $0.30 and $0.80, due to the platform's visually-driven nature and highly engaged user base.
Actionable Tips for Improvement
Lowering your CPC while maintaining click quality is key to stretching your ad budget further. Here are some proven strategies to optimize this metric:
- Refine Audience Targeting: Continuously test different demographic, interest, and behavioral targeting segments to find lower-cost audiences that still convert.
- Improve Ad Relevance: Platforms like Facebook reward ads with high relevance scores by showing them to more people at a lower cost. Focus on creating compelling ad copy and visuals that closely match your audience's interests.
- Leverage Smart Bidding: Start with automatic bidding strategies to allow the platform's algorithm to find the most efficient clicks. As you gather data, you can switch to manual bidding to gain more control over your costs.
6. Return on Ad Spend (ROAS)
Return on Ad Spend (ROAS) is a critical metric for evaluating the financial performance of paid social media campaigns. It directly measures the gross revenue generated for every dollar spent on advertising, providing a clear indication of profitability. Unlike other social media marketing metrics that focus on engagement or reach, ROAS connects ad spend directly to the bottom line, making it indispensable for budget allocation and campaign optimization.
How It's Calculated
The formula for ROAS is straightforward, focusing on revenue versus cost:
(Total Revenue from Ads ÷ Total Ad Spend) = ROAS
The result is a ratio. For example, a ROAS of 4:1 means that for every $1 spent on advertising, you generated $4 in revenue. Accurate tracking is crucial for this calculation, requiring properly configured pixels or tracking codes to attribute sales to specific social media ads.
Industry Benchmarks and Examples
A "good" ROAS varies significantly based on profit margins, industry, and business goals. A common benchmark for many businesses is a 4:1 ratio, but this can differ.
- Reformation: The sustainable fashion brand reportedly achieves an impressive 4:1 ROAS on its Instagram shopping campaigns by leveraging visually appealing content and targeted product ads.
- Zoom: During its peak growth periods, the software company reported a 6:1 ROAS on some of its social campaigns, demonstrating the power of paid social for high-demand B2B services.
- Wayfair: The home goods giant often maintains a 3:1 average ROAS across its various social platforms, balancing high ad volume with consistent profitability.
Actionable Tips for Improvement
Improving your ROAS involves optimizing every stage of your advertising funnel, from targeting to conversion.
- Set Up Proper Conversion Tracking: Ensure your tracking pixels (like the Meta Pixel or TikTok Pixel) are correctly installed and configured to capture accurate revenue data. Without this, you cannot reliably measure ROAS.
- Use Appropriate Attribution Windows: Align your campaign's attribution window with your typical sales cycle. A one-day window is too short for high-ticket items, while a 28-day window might be too long for impulse buys.
- Test Creative and Targeting: Continuously A/B test different ad creatives, copy, and audience segments. Small adjustments can lead to significant improvements in campaign efficiency and, ultimately, your ROAS.
7. Brand Mention and Share of Voice
Understanding your brand's presence in the wider social conversation is crucial for gauging market position and public perception. Brand mention tracking counts how often your brand is discussed across social media, while Share of Voice (SoV) contextualizes this data by measuring your brand's visibility compared to competitors. These are indispensable social media marketing metrics for assessing brand awareness and competitive standing.
How It's Calculated
Calculating these metrics requires dedicated social listening tools.
- Brand Mentions: This is a simple count of all tagged and untagged mentions of your brand, products, or key personnel over a specific period.
- Share of Voice (SoV): The formula is:
(Your Brand Mentions ÷ Total Mentions for All Tracked Brands) x 100 = SoV %
To calculate SoV, you must track your own mentions alongside those of your key competitors within the same timeframe. This percentage reveals how much of the conversation in your industry you actually own.
Industry Benchmarks and Examples
SoV benchmarks are highly industry-specific, as market saturation and the number of competitors vary wildly. The goal is to consistently grow your percentage over time.
- Tesla: In the electric vehicle market, Tesla consistently commands a dominant 40-50% share of voice, leaving competitors to vie for the remaining conversation space. This highlights its brand strength and market leadership.
- Netflix: During major show releases like "Stranger Things," Netflix can generate over 100,000 daily social mentions, temporarily capturing an enormous share of voice in the entertainment streaming discussion.
- Apple: Around an iPhone launch, Apple typically captures more than 60% of the share of voice in smartphone conversations, demonstrating the massive cultural impact of its product events.
Actionable Tips for Improvement
Increasing your brand's presence in social conversations requires a strategic and proactive approach.
- Use Social Listening Tools: Set up alerts in tools like Brand24, Mention, or Google Alerts. Be sure to track variations of your brand name, products, and even executive names to get a complete picture.
- Engage with All Mentions: Respond promptly to both negative and positive mentions. Addressing negative feedback can mitigate reputational damage, while engaging with positive comments helps build a loyal community of brand advocates.
- Create 'Talkable' Campaigns: Launch campaigns, contests, or create content that is inherently shareable and encourages user-generated content mentioning your brand. This directly fuels both your mention count and share of voice.
8. Follower Growth Rate
While a large follower count can be misleading, the rate at which that number grows is a vital health indicator for your social media presence. Follower growth rate measures the speed at which you are attracting new audience members over a specific period, providing direct feedback on your audience-building efforts and content resonance. A steady, positive growth rate shows that your brand is gaining relevance and expanding its reach.
How It's Calculated
This metric is calculated as a percentage to contextualize your growth relative to your existing audience size.
(New Followers in a Period ÷ Starting Follower Count) x 100 = Follower Growth Rate %
Tracking this monthly or quarterly helps you understand which campaigns or content formats are most effective at attracting new followers.
Industry Benchmarks and Examples
Growth rates can fluctuate dramatically based on industry, brand maturity, and platform. New accounts often see higher percentage growth, while established brands may focus on slower, more sustainable expansion.
- Oatly: During its major U.S. launch campaigns, the plant-based milk brand achieved a remarkable 25% monthly follower growth by combining witty content with strategic influencer partnerships.
- Chloe Ting: The fitness influencer capitalized on the 2020 home workout trend, seeing a staggering 200% follower growth during her viral workout challenges, which were highly shareable.
- Charli D'Amelio: At the peak of her TikTok rise, she was a prime example of exponential growth, gaining over one million followers per month through consistent, trend-driven content.
Actionable Tips for Improvement
Sustainably increasing your follower growth rate is about more than just gaining numbers; it's about attracting the right audience that will eventually engage and convert.
- Create Shareable Content: Focus on posts that followers will want to share with their own networks, such as infographics, relatable memes, or valuable tutorials.
- Collaborate Strategically: Partner with influencers and complementary brands in your niche to introduce your profile to relevant, pre-qualified audiences.
- Leverage Trends and Hashtags: Participate in viral challenges and use trending hashtags appropriately to increase your content's visibility beyond your existing followers. Learn more about how to boost your social media engagement to attract and retain new followers.
9. Social media ROI (Return on Investment)
Social media ROI is the ultimate measure of your marketing efforts' financial effectiveness. It quantifies the profit generated from your social media activities relative to the total investment, moving beyond engagement and reach to prove tangible business value. A positive ROI demonstrates that your social media strategy is not just a cost center but a revenue-driving force.
How It's Calculated
The standard formula for calculating social media ROI is:
(Social Media Revenue - Total Social Media Costs) ÷ Total Social Media Costs x 100 = ROI %
To use this formula accurately, you must meticulously track all associated costs, including ad spend, software tools, content creation expenses, and the cost of staff time. Similarly, revenue must be tracked through methods like UTM parameters and platform-specific conversion tracking.
Industry Benchmarks and Examples
Calculating and proving ROI is the holy grail for social media marketers. While specific ROI figures are often kept private, some brands have shared insights into their success, showcasing the potential of a well-executed strategy.
- HubSpot: The B2B software giant famously reports an ROI of around 5:1 on its social media marketing, demonstrating how content-driven strategies can generate significant returns.
- Glossier: This e-commerce beauty brand built its empire on community-driven social content, reportedly achieving an 8:1 ROI by turning followers into loyal customers and brand advocates.
- Wendy's: Known for its viral Twitter campaigns, the restaurant chain has generated an estimated 300% ROI on specific engagement-focused campaigns, proving that personality can translate directly to profit.
Actionable Tips for Improvement
Improving your social media ROI requires a comprehensive and data-driven approach.
- Track All Costs: Include every expense, from salaries and ad budgets to tool subscriptions and content production. An incomplete picture of costs will skew your ROI calculation.
- Use UTM Tracking: Implement consistent UTM parameters across all social media links to accurately attribute website traffic, leads, and sales back to specific platforms and campaigns.
- Assign Value to Non-Monetary Goals: If your goal is brand awareness or customer service, assign a monetary value to these outcomes. For example, calculate the cost savings from handling a customer service query on Twitter versus a call center.
10. Customer Lifetime Value from Social Media
Customer Lifetime Value (CLV) from social media measures the total net profit a business can expect from a single customer acquired through social media channels. This metric shifts the focus from short-term gains like a single purchase to the long-term profitability of your social media efforts, helping you understand the true business impact of customer acquisition and retention.
How It's Calculated
Calculating CLV can be complex, but a basic formula is:
(Average Purchase Value x Average Purchase Frequency Rate) x Average Customer Lifespan = CLV
To isolate the CLV from social media, you must first segment your customers based on their acquisition channel. This requires robust tracking, often using UTM parameters in your social links and integrating data from your CRM and e-commerce platform.
Industry Benchmarks and Examples
CLV is highly specific to each business, making universal benchmarks impractical. The goal is to compare the CLV of customers from social media against those from other channels. A higher CLV from social media indicates a strong ROI.
- Birchbox: The subscription box service discovered that customers acquired through social media platforms have a 25% higher CLV, demonstrating the platform's ability to attract and retain high-value subscribers.
- Stitch Fix: This fashion retailer reports that customers acquired via Instagram campaigns have a CLV nearly twice as high as those from other channels, validating their investment in the platform.
- Slack: The software company found that leads generated from social media channels exhibited 40% longer retention rates, directly contributing to a higher CLV.
Actionable Tips for Improvement
Improving CLV from social media involves attracting the right audience and nurturing the relationship post-acquisition.
- Segment by Channel: Use analytics to track CLV for customers from each social platform (e.g., Instagram vs. LinkedIn) to identify which channels bring in the most valuable long-term customers.
- Use Cohort Analysis: Group customers acquired during specific periods (e.g., Q1 2024) to track their spending behavior over time. This helps you understand if your social media strategies are attracting higher-value customers as time goes on.
- Factor in Referral Value: Social media users are often brand advocates. Factor in the value of new customers they refer to get a more complete picture of their total worth to your business.
Key Metrics Comparison for Social Media Marketing
| Metric | Implementation Complexity 🔄 | Resource Requirements ⚡ | Expected Outcomes 📊 | Ideal Use Cases 💡 | Key Advantages ⭐ |
|---|---|---|---|---|---|
| Engagement Rate | Low - straightforward calculation | Low - standard social platform data | Measures audience interaction quality and content resonance | Evaluating content engagement & organic reach growth | Indicates authentic audience interest |
| Reach and Impressions | Low - basic platform metrics | Low - directly available on platforms | Understands content visibility and brand awareness | Measuring content reach & exposure | Clear picture of audience size and exposure |
| Click-Through Rate (CTR) | Low to Medium - needs tracking clicks and impressions | Low - click and impression data needed | Measures ability to drive traffic to websites or landing pages | Optimizing CTAs and link placements | Direct indicator of traffic-driving effectiveness |
| Conversion Rate | Medium - requires tracking setup | Medium - needs analytics integration | Measures percentage of users completing desired actions | Measuring business impact & ROI from social campaigns | Clear ROI measurement, identifies valuable traffic sources |
| Cost Per Click (CPC) | Medium - linked to paid campaigns | Medium - ad spend and clicks tracking | Measures cost efficiency of paid ads | Budget optimization and bid strategy | Enables ad spend efficiency and platform comparisons |
| Return on Ad Spend (ROAS) | High - requires revenue attribution | High - needs precise revenue and spend tracking | Measures revenue generated per dollar spent | Evaluating campaign profitability | Provides clear advertising profitability |
| Brand Mention and Share of Voice | High - needs advanced monitoring tools | Medium to High - social listening platforms | Insights into brand perception & competitive positioning | Brand awareness & reputation management | Early crisis detection and competitive insights |
| Follower Growth Rate | Low - simple follower count tracking | Low - follower data from platforms | Measures audience growth speed | Tracking audience building efforts | Simple brand awareness indicator |
| Social Media ROI | High - complex attribution required | High - complete cost and revenue tracking | Measures overall financial return from social media | Justifying budgets and comprehensive performance | Comprehensive business impact measurement |
| Customer Lifetime Value (CLV) from Social Media | High - requires long-term data integration | High - customer tracking systems | Measures long-term revenue value of social-acquired customers | Customer acquisition & retention strategy | Justifies higher acquisition costs through value |
Transforming Data into Action: Your Next Steps
Navigating the landscape of social media marketing metrics can feel like learning a new language. We've explored the vocabulary, from fundamental terms like Reach and Engagement Rate to the more advanced, business-critical concepts of Social Media ROI and Customer Lifetime Value. You now have a comprehensive glossary of the ten most essential metrics that can illuminate the true impact of your social media efforts. But understanding the definitions is merely the first step on a much longer, more rewarding journey. The real power isn't in the numbers themselves, but in the stories they tell and the strategic shifts they inspire.
The ultimate goal is to move beyond passive data collection and into a cycle of active, data-driven decision-making. Simply knowing your Click-Through Rate is 2.5% is information; understanding why it's 2.5%, what content formats drive it higher, and how it compares to your industry benchmark is intelligence. This is where your journey as a strategic marketer truly begins.
From Data Points to Strategic Pillars
Your dashboard is filled with potential, but without a clear framework, it's just noise. The key is to connect these individual social media marketing metrics to your overarching business objectives. Don't fall into the trap of tracking everything for the sake of it. Instead, build a focused measurement plan that reflects what truly matters to your organization's success.
To make this transition, consider these immediate next steps:
- Prioritize Ruthlessly: You can't optimize for all ten metrics at once. If your primary goal is lead generation, your focus should be laser-sharp on Conversion Rate, CTR, and Cost Per Click (CPC). If brand awareness is the objective, then Reach, Impressions, and Share of Voice become your north stars. Choose 2-3 primary metrics that directly align with your current campaign goals.
- Establish Your Baseline: You cannot measure progress without a starting point. Spend the next 30 days diligently tracking your chosen metrics to establish a clear baseline. This initial data set will become the benchmark against which all future performance is measured, providing concrete evidence of your growth and the impact of your strategic changes.
- Analyze Content Patterns: Dive into your top-performing and bottom-performing posts. Look beyond the surface. What common threads do you see in your most engaging content? Is it the format (video vs. carousel), the tone (humorous vs. educational), the call to action, or the time of day it was posted? Use these insights to create a hypothesis and test it with your upcoming content.
Cultivating a Culture of Continuous Improvement
The most successful social media strategies are not static; they are fluid, evolving organisms that adapt to new data. Your metrics are the feedback loop that fuels this evolution. Adopting a mindset of continuous improvement means treating every post, every campaign, and every ad as an experiment.
Key Insight: Perfection is not the goal; progress is. Aim for incremental gains month over month. A 5% increase in your engagement rate or a 10% reduction in your CPC is a significant win that, compounded over time, leads to transformative results.
To foster this culture, schedule regular check-ins, perhaps on a weekly or bi-weekly basis, to review your key social media marketing metrics. This isn't just about reporting numbers; it's about asking critical questions. What worked? What didn't? What surprised us? What will we do differently next week? This disciplined approach turns data analysis from a chore into a powerful strategic ritual that drives innovation and refines your approach. By consistently analyzing and acting on this data, you transform your social media presence from a simple communication channel into a predictable, scalable engine for business growth.
Ready to turn your data-driven insights into visually stunning content? Lumeo helps you effortlessly transform key findings, statistics, and performance reports into professional, engaging carousels for social media. Stop letting your valuable analytics die in a spreadsheet; present your success story with the impact it deserves. Discover Lumeo today and start creating content that not only performs but also proves its value.