8 Social Media Metrics to Track for Success in 2025

Unlocking Social Media Success
This listicle reveals eight essential social media metrics to track in 2025. Learn which metrics provide crucial insights into campaign performance and audience behavior. By understanding these key performance indicators (KPIs), you can optimize your social media strategy, improve content effectiveness, and ultimately achieve your business objectives. Mastering social media metrics to track is vital for data-driven decision-making and demonstrable ROI. From engagement rate and reach to conversion rate and customer lifetime value, this list covers the essential data points for social media success. Let's dive in!
1. Engagement Rate
When it comes to measuring the effectiveness of your social media efforts, one of the most crucial social media metrics to track is engagement rate. It provides a valuable snapshot of how well your content resonates with your audience, moving beyond vanity metrics like follower count to reveal the true level of interaction and interest your posts generate. Engagement rate essentially measures the level of active participation your content receives relative to your overall audience size, whether that's measured by followers or reach. This interaction encompasses actions like likes, comments, shares, saves, and even clicks, painting a comprehensive picture of audience involvement.
Engagement rate is calculated using a simple formula: (Total Engagement / Total Followers) × 100 or (Total Engagement / Reach) × 100. While both formulas provide valuable insights, using reach can offer a broader perspective, particularly if your content is being amplified beyond your immediate follower base through shares and viral spread. This metric can be analyzed on various levels – per post, per campaign, or for your overall account performance, providing granular data for optimization. It's important to note that engagement rates vary significantly across platforms and industries. What constitutes a "good" engagement rate on Instagram might be considered low on LinkedIn, and vice-versa. Understanding these nuances is key to accurately assessing your performance.
One of the primary benefits of tracking engagement rate is its ability to indicate content quality and audience connection. High engagement signifies that your content is resonating with your target audience, prompting them to interact beyond passive consumption. This is a vital signal to platform algorithms, which prioritize high-engagement content, leading to increased organic visibility and reach. Unlike vanity metrics like follower count, which can be misleadingly inflated, engagement rate provides a more accurate reflection of your audience's genuine interest. By identifying which content types generate the most engagement, you can tailor your future content strategy for optimal performance. For example, if video content consistently outperforms static images in terms of engagement, you can prioritize video creation in your content calendar. You may even consider exploring a Learn more about Engagement Rate strategy that focuses on driving deeper engagement.
Several brands have successfully leveraged engagement to build strong online communities. Netflix, for example, achieves impressive 3-5% engagement rates on Instagram through pop culture-focused content that resonates with their massive audience. National Geographic maintains a consistent 2-4% engagement rate by sharing stunning visual content that captures the beauty and wonder of the natural world. Glossier, the beauty brand, built its empire on user-generated content and authentic interactions, achieving engagement rates as high as 8-10%. These examples demonstrate the power of engaging content to build brand loyalty and drive business growth.
While engagement rate is a powerful metric, it's essential to be aware of its limitations. It can be artificially inflated through engagement pods or bots, so it's crucial to ensure your engagement is organic and genuine. Furthermore, engagement rate doesn't directly correlate to business outcomes like sales or conversions. While it indicates audience interest, it doesn't guarantee a direct impact on your bottom line. Benchmark rates vary widely across industries, making direct comparisons challenging. Finally, engagement rate may not reflect reach quality or audience relevance. A high engagement rate from a small, irrelevant audience segment is less valuable than a lower engagement rate from a larger, more targeted audience.
To effectively leverage engagement rate, aim for 1-3% on Instagram and 0.5-1% on Facebook, though these are general benchmarks and may vary based on your specific industry and niche. Consistency is key – post regularly and at optimal times for your audience. Encourage active participation by asking questions, responding to comments, and fostering a sense of community. Utilize platform-specific features like Stories, Reels, and polls to boost engagement and diversify your content formats. By understanding the nuances of engagement rate and implementing these actionable tips, you can effectively track and improve your social media performance, building a stronger connection with your target audience and achieving your marketing goals.
2. Reach and Impressions
Among the most fundamental social media metrics to track are reach and impressions. These two intertwined metrics provide valuable insights into the visibility of your content and the potential size of your audience across various social media platforms. Understanding the difference between them, and how to leverage them, is crucial for any successful social media strategy.
Reach represents the number of unique users who have seen your content. Think of it as the number of individual people your message has touched. Impressions, on the other hand, represent the total number of times your content has been displayed, regardless of whether it was seen by the same person multiple times. One user might see your post three times, contributing one to your reach count and three to your impression count. This distinction allows you to understand not only how many people are seeing your content but also how frequently they are exposed to it.
Both reach and impressions can be further categorized into organic (unpaid) and paid. Organic reach refers to the number of people who see your content naturally through their existing network and the platform's algorithm. Paid reach, as the name suggests, comes from sponsored posts and advertising campaigns. Furthermore, your reach includes both your followers and non-followers who encounter your content through shares, hashtags, or other distribution methods. The relationship between impressions and reach can be further analyzed through frequency, calculated by dividing Impressions by Reach. This tells you the average number of times a user has seen your content.
Why are reach and impressions vital social media metrics to track? They provide a foundational understanding of your content's visibility and potential audience size. This information is crucial for evaluating the effectiveness of your content distribution strategy, measuring brand awareness, and understanding how the platform's algorithm is interacting with your content. These metrics also contribute to calculating other key performance indicators, such as engagement rate, which provides a deeper understanding of audience interaction.
There are several documented instances of brands successfully leveraging reach and impressions. Coca-Cola’s #ShareACoke campaign, for example, achieved a global reach of 235 million people, demonstrating the power of a well-executed hashtag campaign. Airbnb, through its focus on user-generated content, reports a 60% higher reach compared to brand-created content, highlighting the importance of authenticity and community engagement. BBC News consistently maintains a weekly reach of 15-20 million across its platforms, illustrating the impact of a consistent and multi-platform approach to content distribution.
While reach and impressions offer valuable insights, it’s important to acknowledge their limitations. High reach doesn't automatically translate into business results. They don't measure the quality of engagement or conversions. A large reach with minimal likes, comments, or shares might indicate that your content isn't resonating with your audience. Similarly, a high reach within a demographic that isn't your target audience isn’t necessarily beneficial. It's crucial to ensure your content is reaching the right people. Lastly, the decline of organic reach on most platforms, particularly Facebook and Instagram, makes understanding paid reach strategies even more critical.
To effectively leverage reach and impressions as social media metrics to track, consider the following actionable tips:
- Track trends over time: Don’t fixate on individual post performance. Instead, analyze reach trends over weeks and months to identify patterns and optimize your strategy accordingly.
- Strategic hashtag usage: Utilize relevant and trending hashtags to increase the discoverability of your content and expand your reach to a wider audience.
- Cross-platform promotion: Share your content across multiple social media platforms to maximize visibility and reach a diverse audience.
- Optimize posting times: Analyze your audience's activity patterns and schedule your posts during peak hours to maximize reach and engagement.
- Monitor reach-to-engagement ratio: This ratio provides insights into content quality and audience resonance. A high reach with low engagement warrants a review of your content strategy.
Learn more about Reach and Impressions to understand how these metrics play a role in platform algorithms, particularly on LinkedIn. By understanding the nuances of reach and impressions and implementing these tips, you can effectively leverage these metrics to improve your social media performance and achieve your business objectives.
3. Click-Through Rate (CTR)
Click-through rate (CTR) is a pivotal metric in social media marketing that measures the effectiveness of your content in driving traffic and actions. It quantifies the percentage of people who click on a specific link, call-to-action, or advertisement after seeing your social media post. Tracking CTR provides valuable insights into audience engagement, content performance, and the success of your social media strategy. This metric deserves a prominent place in your social media analytics toolkit because it directly connects your social media presence to tangible business outcomes like website visits, lead generation, and ultimately, conversions.
CTR applies to both organic posts and paid advertisements, providing a holistic view of how well your content resonates with your audience. Whether you're directing users to your website, a specific landing page, or prompting them to take a specific action (like watching a video or downloading a resource), CTR helps gauge the effectiveness of your calls to action. This metric is calculated as: (Total Clicks ÷ Total Impressions) × 100. For example, if a post receives 1,000 impressions and generates 50 clicks, the CTR is 5%.
One of the key strengths of CTR is its direct connection to action. It moves beyond vanity metrics like likes and shares, focusing on how effectively your content motivates users to take the next step. A high CTR indicates strong audience interest, compelling content, and a clear, effective call to action. This allows you to optimize content and ad creatives to further improve performance and drive even more valuable actions. By analyzing CTR across different platforms, industries, and content types, you can gain a deeper understanding of what resonates with your target audience and refine your social media strategies accordingly. For instance, HubSpot consistently achieves a 2-3% CTR on LinkedIn by sharing educational content tailored to their professional audience. Similarly, BuzzFeed leverages compelling headlines and engaging visuals to maintain an average CTR of 1.5-2% across its social posts. Even more dramatically, Dollar Shave Club’s viral video campaign achieved an impressive 15% CTR to their website, demonstrating the power of engaging content.
However, CTR is not without its limitations. While it measures the effectiveness of driving clicks, it doesn't track what happens after the click. A high CTR doesn’t guarantee conversions or meaningful engagement on the destination page. Furthermore, misleading headlines or clickbait tactics can artificially inflate CTR without reflecting genuine interest. External factors like landing page quality and website user experience can also influence CTR, making it important to consider the entire user journey.
To effectively leverage CTR, focus on creating compelling, clear calls to action that encourage users to click. Use eye-catching visuals and headlines that grab attention and clearly communicate the value proposition of your linked content. Test different link placements and formats to optimize for maximum visibility and clickability. Ensuring mobile optimization for linked content is crucial, as a significant portion of social media traffic comes from mobile devices. A/B testing different creative approaches allows you to identify what resonates best with your audience and continuously improve your CTR. Digital marketing pioneers like Gary Vaynerchuk have long emphasized the importance of actionable content, driving the focus on metrics like CTR. Performance marketing teams at companies like Facebook and Google also heavily rely on CTR to optimize ad campaigns and maximize return on investment.
The following infographic visualizes the process of calculating CTR based on impressions and clicks.
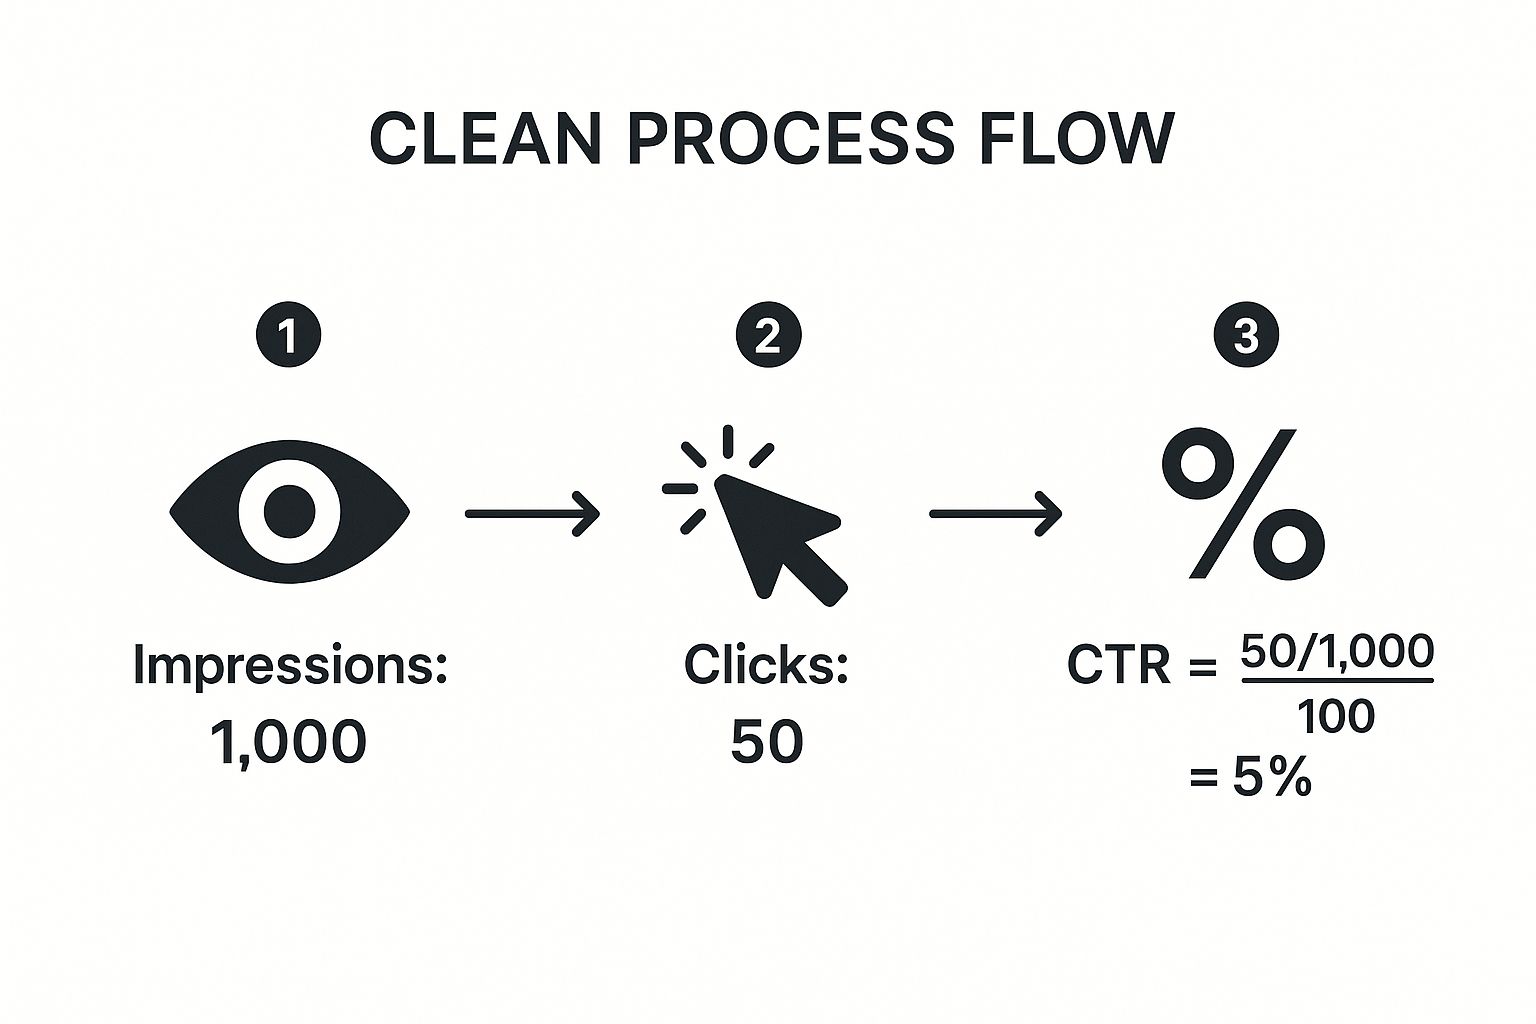
As the infographic demonstrates, starting with 1,000 impressions, if 50 users click on the link, the CTR is calculated to be 5%. This simple visualization clarifies the relationship between impressions, clicks, and the resulting CTR. Understanding this flow is crucial for interpreting CTR data and using it to optimize your social media strategies. By focusing on increasing clicks while maintaining or increasing impressions, you can improve your CTR and drive more traffic to your desired destinations. This process underscores the importance of not just reaching a large audience (impressions) but also engaging them effectively to take desired actions (clicks).
4. Conversion Rate
Conversion rate is a crucial social media metric to track, providing a direct link between your social media efforts and tangible business outcomes. It measures the percentage of users who complete a desired action – a conversion – after interacting with your content. These actions could range from making a purchase and signing up for a newsletter to downloading an app or even taking a quiz. Tracking this metric allows you to understand how effectively your social media strategy is driving valuable actions and contributing to your return on investment (ROI). This is why it deserves a prominent place on any list of essential social media metrics to track.
So how does it work? Conversion rate is calculated by dividing the number of conversions by the total number of clicks on your social media content, then multiplying by 100. For example, if 100 people click on your Instagram ad and 2 of them make a purchase, your conversion rate is 2%. This seemingly simple calculation reveals the effectiveness of your social media content in driving desired user behavior.
The ability to track multiple conversion types is a key feature of this metric. You can monitor macro-conversions, which represent significant actions like purchases, alongside micro-conversions, like email sign-ups or content downloads. This granular approach allows you to understand user engagement at different stages of the sales funnel. Accurately measuring conversion rate, however, requires implementing tracking mechanisms like pixels or UTM parameters, which provide insights into user journeys from social media platforms to your website.
One of the major benefits of tracking conversion rate is its direct connection to business impact and ROI. By understanding which social media activities lead to conversions, you can justify your social media marketing investment and demonstrate its value to stakeholders. Furthermore, tracking conversion rates helps identify your most valuable traffic sources, allowing you to optimize your strategy and allocate resources effectively. For example, if you find that Instagram traffic consistently yields higher conversion rates compared to Facebook, you can prioritize Instagram in your social media strategy.
The advantages are clear, but there are some challenges associated with tracking conversion rates. Setting up sophisticated tracking systems can be complex and requires technical expertise. Additionally, accurately attributing conversions solely to social media can be tricky due to the multifaceted nature of customer journeys. Users may interact with your brand across multiple touchpoints before converting, making it difficult to isolate the impact of social media. Finally, while a low conversion rate might indicate areas for improvement, it doesn't always signal poor performance. Factors outside of your social media efforts, such as website usability or product pricing, can also influence conversion rates.
Numerous businesses have demonstrated the power of leveraging conversion rate as a key performance indicator. Warby Parker, for example, achieves a 2-3% conversion rate from their Instagram traffic, demonstrating the platform's effectiveness in driving sales. Shopify boasts average social media campaign conversion rates of 1.5-2.5%, highlighting the platform's potential for driving business growth. Casper, a sleep products company, achieves an impressive 4-6% conversion rate for their targeted Facebook ads promoting a sleep quiz, illustrating the effectiveness of targeted campaigns in driving specific user actions. These examples underscore the importance of conversion rate optimization in achieving business objectives.
To effectively leverage conversion rate as a social media metric, consider the following actionable tips:
- Implement robust tracking: Set up Google Analytics and platform-specific pixels to accurately track conversions and user behavior.
- Utilize UTM parameters: Tag your social media links with UTM parameters to gain granular insights into the performance of different social media sources.
- Mobile optimization: Ensure your landing pages are optimized for mobile users, as a significant portion of social media traffic comes from mobile devices.
- Retargeting: Implement retargeting campaigns on social media to re-engage website visitors who haven't converted.
- Track micro-conversions: Don't just focus on macro-conversions like purchases. Track micro-conversions such as email sign-ups and content downloads to understand user engagement at different funnel stages.
By following these tips and consistently monitoring your conversion rate, you can optimize your social media strategy, improve your ROI, and achieve your business goals. Learn more about Conversion Rate and discover further strategies to enhance your social media performance. Tracking conversion rates is not just about numbers; it’s about understanding the value your social media efforts bring to your business. By focusing on this metric, you can turn social media engagement into tangible results.
5. Brand Mention and Sentiment
Among the crucial social media metrics to track, brand mention and sentiment analysis stands out as a powerful indicator of your brand's health and reputation in the digital landscape. This metric goes beyond simply counting how often your brand is mentioned; it delves into the emotional tone behind those mentions, providing invaluable insights into public perception and potential areas for improvement. By monitoring both the volume and sentiment of brand conversations, you can gain a real-time understanding of how your audience perceives your brand, identify emerging issues, and measure the effectiveness of your social media strategies. This makes it a vital component of any successful social media marketing plan.
How Brand Mention and Sentiment Tracking Works:
This two-pronged approach combines brand monitoring with sentiment analysis. Brand monitoring involves tracking all mentions of your brand across various social media platforms, including both tagged (@mentions) and untagged mentions (where your brand name is mentioned without a direct tag). This comprehensive approach ensures you capture the full spectrum of online conversations related to your brand.
Sentiment analysis, powered by natural language processing (NLP), then categorizes these mentions as positive, negative, or neutral. Sophisticated algorithms analyze the language used in each mention, interpreting words and phrases to gauge the underlying emotion. This allows you to understand not just that people are talking about your brand, but how they feel about it.
Features of Effective Brand Mention and Sentiment Tools:
- Tagged and Untagged Mention Tracking: Capturing both types of mentions provides a holistic view of brand conversations.
- Sentiment Analysis via NLP: Automated sentiment analysis using natural language processing efficiently categorizes mentions.
- Multi-Platform Monitoring: Track mentions across all relevant platforms—Twitter, Facebook, Instagram, forums, blogs, etc.—from a single dashboard.
- Competitor Mention Tracking: Benchmark your brand's performance against competitors by monitoring their mentions and sentiment.
Pros of Tracking Brand Mention and Sentiment:
- Real-time Brand Health Insights: Gain immediate understanding of public perception and identify potential crises before they escalate.
- Customer Service Opportunities: Discover and respond to customer complaints and compliments promptly, fostering positive relationships.
- Proactive Reputation Management: Address negative sentiment and mitigate potential damage to your brand's image.
- Brand Awareness and Share of Voice Measurement: Track how often your brand is mentioned compared to competitors, providing insights into market share and brand visibility.
Cons of Tracking Brand Mention and Sentiment:
- Sentiment Analysis Inaccuracy: Sarcasm, complex language, and cultural nuances can sometimes lead to misinterpretation of sentiment.
- Tool Dependency: Comprehensive monitoring often requires specialized tools, which can be an added expense.
- False Positives: Generic brand names or mentions unrelated to your business can be mistakenly included in the analysis.
- Quantifying Business Impact: While sentiment provides valuable insights, directly correlating it to business outcomes can be challenging.
Examples of Successful Implementation:
- Nike: The athletic giant monitors over 50,000 brand mentions monthly, consistently maintaining a positive sentiment score of around 70%. This allows them to understand public perception and tailor their marketing efforts accordingly.
- Starbucks: By actively monitoring brand mentions, Starbucks can identify and address customer complaints within hours, demonstrating their commitment to customer service and preventing negative experiences from escalating.
- Tesla: Studies have shown a correlation between Tesla's social media sentiment and its stock price movements, highlighting the impact of public perception on financial performance.
Actionable Tips for Tracking Brand Mention and Sentiment:
- Set up Alerts: Configure alerts for sudden spikes in negative sentiment, enabling rapid response to potential crises.
- Respond Promptly: Engage with both positive and negative mentions, demonstrating responsiveness and building relationships with your audience.
- Track Industry Keywords: Monitor relevant industry keywords and competitor mentions to stay informed about market trends and competitor activities.
- Inform Content Strategy: Use sentiment trends to understand what resonates with your audience and adjust your content strategy accordingly.
- Combine Quantitative and Qualitative Analysis: While quantitative data like mention volume and sentiment scores are valuable, complement them with qualitative analysis of individual mentions to gain deeper insights.
When and Why to Use This Approach:
Brand mention and sentiment tracking is essential for any business with an online presence. It's particularly valuable for:
- Crisis Management: Proactive monitoring allows you to identify and address potential crises before they escalate.
- Customer Service: Quickly identify and respond to customer feedback, both positive and negative.
- Campaign Measurement: Track the impact of marketing campaigns on brand perception and sentiment.
- Competitive Analysis: Understand how your brand's sentiment compares to competitors and identify opportunities to differentiate.
By incorporating brand mention and sentiment analysis into your social media metrics to track, you gain a crucial advantage in understanding your audience, protecting your brand reputation, and optimizing your social media strategy for maximum impact.
6. Follower Growth Rate
Follower growth rate is a crucial social media metric that measures the speed at which your audience expands over a specific time period. It provides valuable insights into the effectiveness of your content strategy, engagement efforts, and overall brand appeal. By tracking follower growth rate, you can gauge whether your social media activities are successfully attracting new audience members and building a sustainable online community. This metric goes beyond simply counting followers; it reveals the rate of growth, offering a dynamic perspective on your audience acquisition. This is why it deserves a prominent place on your list of social media metrics to track.

Calculating follower growth rate involves a simple formula: ((New Followers - Lost Followers) ÷ Total Followers) × 100. This formula accounts for both the influx of new followers and the loss of existing ones, providing a net growth percentage. It's essential to track this metric over specific time periods – weekly, monthly, or quarterly – to identify trends and patterns. Analyzing growth rate across various platforms simultaneously offers a comprehensive understanding of your overall social media performance.
This metric is invaluable for social media marketers, content creators, digital marketing agencies, small business owners, and corporate professionals alike. It offers a tangible way to assess the impact of campaigns, identify successful content strategies, and ultimately, understand audience engagement.
Features of Tracking Follower Growth Rate:
- Net Growth Calculation: Accounts for both gained and lost followers, providing a more accurate representation of growth.
- Time-Based Measurement: Tracked over defined periods (e.g., weekly, monthly, quarterly) for trend analysis.
- Cross-Platform Tracking: Can be monitored across multiple social media platforms for a holistic view.
- Benchmarking: Facilitates comparison with competitors to identify industry best practices and areas for improvement.
Pros of Tracking Follower Growth Rate:
- Content Strategy Effectiveness: A high growth rate suggests that your content resonates with your target audience.
- Brand Awareness & Interest: Increased follower growth can indicate growing brand visibility and interest in your offerings.
- Future Reach & Engagement Potential: A larger audience base translates to potentially higher reach and engagement for future content.
- Competitive Benchmarking: Tracking competitor growth rates allows you to assess your performance relative to the industry.
Cons of Tracking Follower Growth Rate:
- Quality over Quantity: A large number of followers doesn't necessarily translate to engaged users or business outcomes. Focus on attracting relevant followers who align with your brand.
- Artificial Inflation: Fake or inactive followers can artificially inflate growth rates, providing a misleading picture of your actual audience. Regularly audit and remove these accounts.
- Indirect Correlation to Business Outcomes: Follower growth doesn't directly translate to sales or conversions. It's a valuable indicator of brand awareness and reach, but not a direct measure of business success.
- Platform Algorithm Fluctuations: Algorithm changes can impact follower growth, making it important to consider external factors when analyzing trends.
Examples of Successful Implementation:
- MrBeast: Gained 10 million YouTube subscribers in 2023, representing a 20% growth rate, demonstrating the power of engaging content.
- Duolingo: Achieved a 500% growth rate on TikTok in 2022 by leveraging viral content trends and creative language learning strategies.
- Patagonia: Maintains a steady 2-3% monthly growth rate by focusing on authentic environmental content that resonates with their target audience.
Actionable Tips for Tracking and Improving Follower Growth Rate:
- Aim for Sustainable Growth: A 2-5% monthly growth rate is generally considered sustainable for long-term audience building.
- Prioritize Relevant Followers: Focus on attracting followers who are genuinely interested in your brand and offerings, rather than pursuing vanity metrics.
- Analyze Content Performance: Identify the types of content that drive the most new followers and replicate those successes.
- Increase Discoverability: Use relevant hashtags, engage in collaborations, and participate in online communities to expand your reach.
- Regularly Audit Followers: Remove fake or inactive followers to maintain an accurate representation of your audience and prevent inflated growth rates.
By understanding the nuances of follower growth rate and implementing these tips, you can effectively leverage this metric to build a strong and engaged social media community, ultimately contributing to the overall success of your online presence. Remember, while tracking follower growth rate is essential, it's only one piece of the social media puzzle. Combine this metric with other key performance indicators to gain a comprehensive understanding of your social media performance.
7. Share of Voice (SOV)
Share of Voice (SOV) is a crucial social media metric to track for anyone aiming to understand their brand's standing within the competitive landscape. It measures the percentage of the overall online conversation within your industry or niche that is related to your brand, compared to your competitors. Tracking SOV provides valuable insights into your brand's visibility, reputation, and overall market position, enabling you to identify opportunities to amplify your message and participate more effectively in relevant discussions. In essence, it answers the question: "How much of the online chatter about my industry is about my brand?"
How SOV Works and Why It Matters
SOV is calculated by dividing the number of mentions your brand receives by the total number of mentions across your industry, then multiplying by 100. This gives you a percentage representing your share of the online conversation. This seemingly simple calculation unlocks a wealth of information. A high SOV generally indicates strong brand awareness, active engagement, and potentially a leading market position. Conversely, a low SOV might suggest a need to increase brand visibility, refine content strategies, or explore new avenues for engagement.
It's important to note that SOV can be measured in different ways, providing a multifaceted understanding of your brand's presence. You can track SOV by:
- Volume: This is the most common approach, simply measuring the raw number of mentions.
- Sentiment: This measures the positive, negative, or neutral sentiment associated with your brand mentions, providing insights into brand perception.
- Engagement: This tracks the level of interaction (likes, shares, comments) generated by your brand mentions, indicating audience interest and content effectiveness.
Illustrative Examples of SOV in Action
Understanding SOV is best achieved through real-world examples. Consider these scenarios:
- Apple: In the highly competitive smartphone market, Apple consistently maintains a significant SOV, often between 30-40% in online discussions related to mobile technology. This indicates their strong brand presence and dominance in the conversation.
- Netflix: Within the streaming services arena, Netflix holds a substantial SOV, perhaps around 45%, highlighting their leadership position and widespread recognition in the streaming conversation.
- Nike vs. Adidas: In the athletic wear industry, Nike often dominates discussions, boasting a 25% SOV compared to Adidas' 15%. This disparity reveals Nike's stronger online presence and greater share of the conversation surrounding athletic apparel.
These examples showcase how SOV can be a powerful indicator of market position and brand awareness within a specific industry.
Actionable Tips for Tracking and Leveraging SOV
To effectively utilize SOV as a social media metric to track, consider the following tips:
- Clearly Define Your Competitive Set: Identify your direct competitors. This will ensure your SOV calculations are relevant and provide meaningful insights into your competitive landscape.
- Track Trends Over Time: Don't rely on single snapshots. Monitor SOV trends over weeks, months, and years to understand how your brand's presence evolves in relation to your competitors.
- Analyze Competitors' SOV: Investigate what drives your competitors' share of voice. What content resonates? What platforms are they leveraging? These insights can inform your own strategy.
- Identify Underserved Conversation Topics: Look for gaps in the conversation where your brand can contribute unique value and potentially gain SOV.
- Monitor SOV During Product Launches and Campaigns: Track SOV before, during, and after campaigns to measure their impact on brand visibility and conversation share.
Pros and Cons of Tracking SOV
While SOV is a valuable metric, it’s important to be aware of both its advantages and limitations:
Pros:
- Provides Competitive Intelligence: Understand your brand's position relative to competitors.
- Identifies Content Gaps and Opportunities: Discover underserved topics and tailor content accordingly.
- Measures Brand Awareness: Gauge your brand's visibility within the industry conversation.
- Guides Content Strategy and Campaign Planning: Inform data-driven decisions about content creation and campaign execution.
Cons:
- Requires Comprehensive Competitor Analysis: Accurate SOV requires diligent tracking of competitor activity.
- May Not Reflect Actual Market Share or Revenue: High SOV doesn't guarantee high sales.
- Can Be Skewed by One-Time Events: Viral moments can temporarily inflate SOV.
- Difficult to Measure Across All Platforms: Capturing all relevant mentions across various platforms can be challenging.
Despite these limitations, tracking Share of Voice remains a vital component of any comprehensive social media strategy. By understanding and monitoring your SOV, you gain valuable insights into your brand's competitive landscape and identify actionable opportunities to enhance your online presence and ultimately achieve your marketing objectives. By incorporating SOV as one of the social media metrics to track, you’re equipping yourself with the knowledge to navigate the complexities of the digital landscape and effectively amplify your brand's voice.
8. Customer Lifetime Value from Social (CLV)
Among the numerous social media metrics to track, Customer Lifetime Value from Social (CLV) stands out as a crucial indicator of long-term success. It moves beyond vanity metrics like likes and followers and delves into the true financial impact of your social media marketing efforts. CLV measures the total revenue a customer acquired through social media channels will generate throughout their entire relationship with your brand. Understanding this metric empowers you to make data-driven decisions about your social media strategies, optimize your spending, and ultimately, maximize your return on investment.
Understanding the Mechanics of Social CLV
CLV from Social isn't just about immediate sales; it’s about projecting the future value of each customer acquired through your social channels. It takes into account repeat purchases, customer retention, and the overall lifespan of a customer’s engagement with your brand. This holistic view allows you to assess the true profitability of your social media marketing beyond the initial conversion.
The basic formula for calculating CLV is:
Average Purchase Value × Purchase Frequency × Customer Lifespan = CLV
However, applying this to social media requires segmenting customers based on their acquisition channel. This allows you to compare the CLV of customers acquired through different platforms like Facebook, Instagram, TikTok, or Twitter. This granular analysis reveals which social channels are delivering the most valuable customers and which require adjustments in your strategy. For example, you might discover that customers acquired through Instagram have a significantly higher CLV than those acquired through Facebook, indicating that Instagram is a more effective platform for reaching your target audience and driving high-value conversions.
Success Stories: Demonstrating the Power of Social CLV
Several brands have effectively leveraged social CLV to optimize their marketing strategies and achieve impressive results. Glossier, a beauty brand with a strong Instagram presence, discovered that customers acquired through Instagram have a 40% higher CLV than those acquired through other channels. This insight validated their focus on Instagram marketing and informed decisions about content creation and influencer collaborations. Similarly, Spotify identified that users acquired through social media demonstrate 25% better retention rates, highlighting the platform's effectiveness in building a loyal customer base. Sephora, a leading beauty retailer, found that customers acquired through TikTok have 30% higher average order values, demonstrating the platform’s potential for driving higher spending per customer. These examples illustrate how understanding social CLV can provide invaluable insights for strategic planning and resource allocation.
Actionable Tips for Tracking and Optimizing Social CLV
Implementing effective social CLV tracking requires a strategic approach. Here are some actionable tips to get started:
- Implement cohort analysis: Group customers acquired within a specific timeframe (e.g., all customers acquired through Instagram in Q1 2024) and track their purchase behavior over time. This reveals how customer value evolves and helps identify trends in retention and spending.
- Utilize customer data platforms (CDPs): CDPs connect social media interactions with purchase data, allowing you to attribute revenue to specific social channels and campaigns. This provides a clear picture of which social activities are driving the most valuable customers.
- Track both direct and assisted conversions: Don't just focus on direct purchases from social media ads. Track assisted conversions where social media played a role in the customer journey, even if the final purchase occurred through a different channel.
- Segment analysis by demographic and behavioral factors: Combine CLV analysis with demographic and behavioral data to identify high-value customer segments within your social audience. This allows for targeted campaigns and personalized messaging to maximize ROI.
- Compare CLV ratios across different social platforms: Regularly compare CLV across your social channels to understand which platforms are delivering the highest return and adjust your budget allocation accordingly.
Why Social CLV Deserves a Place in Your Metrics Dashboard
In the crowded landscape of social media metrics, CLV from social media deserves a prominent position because it provides a true measure of long-term value. It goes beyond vanity metrics and focuses on the financial impact of your social media efforts. While other metrics can provide insights into engagement and reach, social CLV offers a clear picture of the profitability of each customer acquired through your social channels. This knowledge empowers you to make strategic decisions about resource allocation, content creation, and campaign optimization. While calculating social CLV can be complex and requires sophisticated tracking, the insights gained are essential for maximizing your social media ROI and achieving sustainable growth. By understanding which social channels are driving the most valuable customers, you can refine your strategies, allocate your budget effectively, and build a loyal customer base that contributes to your long-term success.
Key Metrics Comparison Overview
| Metric | Implementation Complexity 🔄 | Resource Requirements ⚡ | Expected Outcomes 📊 | Ideal Use Cases 💡 | Key Advantages ⭐ |
|---|---|---|---|---|---|
| Engagement Rate | Moderate - requires engagement tracking and platform data integration | Low to moderate - mainly social platform analytics | Measures content resonance and interaction quality | Content performance analysis, audience engagement | Indicates quality and audience connection; boosts algorithm favorability |
| Reach and Impressions | Low - standard platform metrics | Low - basic reporting tools | Measures content visibility and potential audience size | Brand awareness, distribution monitoring | Shows overall content exposure; helps evaluate algorithm effectiveness |
| Click-Through Rate (CTR) | Moderate - requires tracking clicks vs impressions | Moderate - needs link tracking and analytics setup | Measures content effectiveness at driving traffic | Traffic generation, ad performance optimization | Directly indicates audience intent and content actionability |
| Conversion Rate | High - requires pixel/UTM tracking and attribution | High - needs advanced tracking and analytics platforms | Measures business impact and ROI from social campaigns | ROI measurement, funnel optimization | Connects social media efforts to tangible business results |
| Brand Mention and Sentiment | High - involves NLP and multi-platform monitoring | High - specialized social listening tools | Provides brand perception and reputation insights | Reputation management, competitive monitoring | Real-time brand health insights; aids proactive response |
| Follower Growth Rate | Low - follower count tracking and calculations | Low - standard analytics dashboards | Measures audience growth speed and sustainability | Community building, trend analysis | Indicates content strategy effectiveness and audience interest |
| Share of Voice (SOV) | High - needs comprehensive competitor and industry data | High - advanced monitoring and analytics platforms | Reveals market conversation share relative to competitors | Competitive intelligence, content strategy | Provides competitive positioning and market presence insights |
| Customer Lifetime Value | Very High - requires CRM/data integration and attribution modeling | Very High - sophisticated tracking and analytics systems | Measures long-term revenue from social-acquired customers | Strategic marketing spend, ROI, customer segmentation | True ROI measure; guides long-term strategy and marketing allocation |
Elevate Your Social Media Strategy
Mastering the right social media metrics to track is crucial for any successful social media strategy. From engagement rate and reach to conversion rate and customer lifetime value (CLV), understanding these eight key indicators provides a comprehensive view of your performance. By analyzing metrics like click-through rate (CTR) and share of voice (SOV), you can identify what resonates with your audience and adjust your content strategy accordingly. Tracking brand mentions and sentiment helps you understand public perception and manage your online reputation. Moreover, keeping a close eye on follower growth rate helps gauge the effectiveness of your audience-building efforts.
To further enhance your social media strategy, consider tracking a wider range of campaign performance metrics which can offer deeper insights into the effectiveness of your overall marketing efforts. This resource from Creativize explores various metrics that can help boost your ROI.
These social media metrics to track empower you to transform your social presence from a guessing game into a data-driven powerhouse. By consistently tracking and analyzing these key indicators, you gain the insights needed to refine content, optimize campaigns, and achieve measurable business results. This translates to increased brand awareness, stronger customer relationships, and ultimately, a more impactful bottom line.
Want to streamline your content creation process and boost engagement across multiple platforms? Lumeo can transform your text-based posts into captivating visual carousels, making it easier to capture attention and improve those all-important social media metrics to track. Check out Lumeo today and start creating content that truly resonates.